Released: benchee 0.10, HTML, CSV and JSON plugins

It’s been a little time since the last benchee release, have we been lazy? Au contraire mes ami! We’ve been hard at work, greatly improving the internals, adding a full system for hooks (before_scenarion, before_each, after_each, after_scenario) and some other great improvements thanks to many contributions. The releases are benchee 0.10.0 (CHANGELOG), benchee_csv 0.7.0 (CHANGELOG), benchee_html 0.4.0 (CHANGELOG) and benchee_json 0.4.0 (CHANGELOG).

Sooo… what’s up? Why did it take so long?

benchee

Before we take a look at the exciting new features, here’s a small summary of major things that happened in previous releases that I didn’t manage to blog about due to lack of time:

0.7.0 added mainly convenience features, but benchee_html 0.2.0 split up the HTML reports which made it easier to find what you’re looking for but also alleviated problems with rendering huge data sets (the graphing library was reaching its limits with that many graphs and input values)

0.8.0 added type specs for the major public functions, configuration is now a struct so errors out on unrecognized options

0.9.0 is one of my favorite releases as it now gathers and shows system data like number of cores, operating system, memory and cpu speed. I love this, because normally when I benchmark I and write about it I need to write it up in the blog post. Now with benchee I can just copy & paste the output and I get all the information that I need! This version also facilitates calling benchee from Erlang, so benchee:run is in the cards.

Now ahead, to the truly new stuff:

Scenarios

In benchee each processing step used to have its own main key in the main data structure (suite): run_times, statistics, jobs etc. Philosophically, that was great. However, it got more cumbersome in the formatters especially after the introduction of inputs as access now required an additional level of indirection (namely, the input). As a result, to get all the data for a combination of job and input you want to format you have got to merge the data of multiple different sources. Not exactly ideal. To make matters worse, we want to add memory measurements in the future… even more to merge.

Long story short, Devon and I sat down in person for 2 hours to discuss how to best deal with this, how to name it and all accompanying fields. We decided to keep all the data together from now on – for every entry of the result. That means each combination of a job you defined and an input. The data structure now keeps that along with its raw run times, statistics etc. After some research we settled on calling it a scenario.


defmodule Benchee.Benchmark.Scenario do
@moduledoc """
A Scenario in Benchee is a particular case of a whole benchmarking suite. That
is the combination of a particular function to benchmark (`job_name` and
`function`) in combination with a specific input (`input_name` and `input`).
It then gathers all data measured for this particular combination during
`Benchee.Benchmark.measure/3` (`run_times` and `memory_usages`),
which are then used later in the process by `Benchee.Statistics` to compute
the relevant statistics (`run_time_statistics` and `memory_usage_statistics`).
"""
@type t :: %__MODULE__{
job_name: binary,
function: fun,
input_name: binary | nil,
input: any | nil,
run_times: [float] | [],
run_time_statistics: Benchee.Statistics.t | nil,
memory_usages: [non_neg_integer] | [],
memory_usage_statistics: Benchee.Statistics.t | nil,
before_each: fun | nil,
after_each: fun | nil,
before_scenario: fun | nil,
after_scenario: fun | nil
}
end

This was a huge refactoring but we really like the improvements it yielded. Devon wrote about the refactoring process in more detail.

It took a long time, but it didn’t add any new features – so no reason for a release yet. Plus, of course all formatters also needed to get updated.

Hooks

Another huge chunk of work went into a hooks system that is pretty fully featured. It allows you to execute code before and after invoking the benchmark as well as setup code before a scenario starts running and teardown code for after a scenario stopped running.

That seems weird, as most of the time you won’t need hooks. We could have released with part of the system ready, but I didn’t want to (potentially) break API again and so soon if we added arguments or found that it wasn’t quite working to our liking. So, we took some time to get everything in.

So what did we want to enable you to do?

  • Load a record from the database in before_each and pass it to the benchmarking function, to perform an operation with it without counting the time for loading the record towards the benchmarking results
  • Start up a process/service in before_scenario that you need for your scenario to run, and then…
  • …shut it down again in after_scenario, or bust a cache
  • Or if you want your benchmarks to run without a cache all the time, you can also bust it in before_each or after_each
  • after_each is also passed the return value of the benchmarking function so you can run assertions on it – for instance for all the jobs to see if they are truly doing the same thing
  • before_each could also be used to randomize the input a bit to benchmark a more diverse set of inputs without the randomizing counting towards the measured times

All of these hooks can be configured either globally so that they run for all the benchmarking jobs or they can be configured on a per job basis. The documentation for hooks over at the repo is a little blog post by itself and I won’t repeat it here 😉

As a little example, here is me benchmarking hound:


# ATTENTION: gotta start phantomjs via `phantomjs –wd` first..
Application.ensure_all_started(:hound)
{:ok, server} = SimpleServer.start
Application.put_env(:hound, :app_host, "http://localhost")
Application.put_env(:hound, :app_port, SimpleServer.port(server))
use Hound.Helpers
Benchee.run(%{
"fill_in text_field" => fn ->
fill_field({:name, "user[name]"}, "Chris")
end,
"visit forms" => fn ->
navigate_to("#{server.base_url}/forms.html")
end,
"find by css #id" => fn ->
find_element(:id, "button-no-type-id")
end
},
time: 18,
formatters: [
Benchee.Formatters.HTML,
Benchee.Formatters.Console
],
html: [file: "benchmarks/html/hound.html"],
before_scenario: fn(input) ->
Hound.start_session()
navigate_to("#{server.base_url}/forms.html")
input
end,
after_scenario: fn(_return) ->
Hound.end_session
end)

Hound needs to start before we can benchmark it. Howeer, hound seems to remember the started process by the pid of self() at that time. That’s a problem because each benchee scenario runs in its own process, so you couldn’t just start it before invoking Benchee.run. I found no way to make the benchmark work with good old benchee 0.9.0, which is also what finally brought me to implement this feature. Now in benchee 0.10.0 with before_scenario and after_scenario it is perfectly feasible!

Why no 1.0?

With all the major improvements one could easily call this a 1.0. Or 0.6.0 could have been a 1.0 then we’d be at 2.0 now – wow that sounds mature!

Well, I see 1.0 as a promise – a promise for plugin developers and others that compatibility won’t be broken easily and not soon. Can’t promise this when we just broke plugin compatibility in a major way. That said, I really feel good about the new structure, partly because we put so much time and thought into figuring it out, but also because it has greatly simplified some implementations and thinking about some future features it also makes them a lot easier to implement.

Of course, we didn’t break compatibility for users. That has been stable since 0.6.0 and to a (quite big) extent beyond that.

So, 1.0 will of course be coming some time. We might get some more bigger features in that could break compatibility (although I don’t think they will, it will just be new fields):

  • Measuring memory consumption
  • recording and loading benchmarking results
  • … ?

Also before a 1.0 release I probably want to extract more not directly benchmarking related functionality from benchee and provide as general purpose libraries. We have some sub systems that we build for us and would provide value to other applications:

  • Unit: convert units (durations, counts, memory etc.), scale them to a “best fit” unit, format them accordingly, find a best fit unit for a collection of values
  • Statistics: All the statistics we provide including not so easy/standard ones like nth percentile and mode
  • System: gather system data like elixir/erlang version, CPU, Operating System, memory, number of cores

Thanks to the design of benchee these are all already fairly separate so extracting them is more a matter of when, not how. Meaning, that we have all the functionality in those libraries that we need so that we don’t have to make a coordinated release for new features across n libraries.

benchee_html

Selection_045.png

Especially due to many great community contributions (maybe because of Hacktoberfest?) there’s a number of stellar improvements!

  • System information is now also available and you can toggle it with the link in the top right
  • unit scaling from benchee “core” is now also used so it’s not all in micro seconds as before but rather an appropriate unit
  • reports are automatically opened in your browser after the formatter is done (can of course be deactivated)
  • there is a default file name now so you don’t HAVE to supply it

What’s next?

Well this release took long – hope the next one won’t take as long. There’s a couple of improvements that didn’t quite make it into the release so there might be a smaller new release relatively soon. Other than that, work on either serializing or the often requested “measure memory consumption” will probably start some time. But first, we rest a bit 😉

Hope you enjoy benchmarking and if you are missing a feature or getting hit by a bug, please open an issue


Slides: Stop Guessing and Start Measuring (Poly-Version)

Hello from the amazing Polyconf! I just gave my Stop Guessing and Start Measuring talk and if you are thinking “why do you post the slides of this SO MANY TIMES”, well the first one was an Elixir version, then a Ruby + Elixir version and now we are at a Poly version. The slides are mostly different and I’d say about ~50% of them are new. New topics covered include:

  • MJIT – what’s wrong with the benchmarks – versus TruffleRuby
  • JavaScript!
  • other nice adjustments

The all important video isn’t in the PDF export but you can see a big part of it on Instagram.

You can view the slides here or on speakerdeck, slideshare or PDF.

Abstract

“What’s the fastest way of doing this?” – you might ask yourself during development. Sure, you can guess, your intuition might be correct – but how do you know? Benchmarking is here to give you the answers, but there are many pitfalls in setting up a good benchmark and analyzing the results. This talk will guide you through, introduce best practices, and surprise you with some unexpected benchmarking results. You didn’t think that the order of arguments could influence its performance…or did you?


Slides: How fast is it really? Benchmarking in Elixir

I’m at Elixirlive in Warsaw right now and just gave a talk. This talk is about benchmarking – the greater concepts but concrete examples are in Elixir and it works with my very own library benchee to also show some surprising Elixir benchmarks. The concepts are applicable in general and it also gets into categorizing benchmarks into micro/macro/application etc.

If you’ve been here and have feedback – positive or negative. Please tell me 🙂

Slides are available as PDF, speakerdeck and slideshare.

Abstract

“What’s the fastest way of doing this?” – you might ask yourself during development. Sure, you can guess what’s fastest or how long something will take, but do you know? How long does it take to sort a list of 1 Million elements? Are tail-recursive functions always the fastest?

Benchmarking is here to answer these questions. However, there are many pitfalls around setting up a good benchmark and interpreting the results. This talk will guide you through, introduce best practices and show you some surprising benchmarking results along the way.

Released: benchee 0.6.0, benchee_csv 0.5.0, benchee_json and benchee_html – HTML reports and nice graphs!

The last days I’ve been hard at work to polish up and finish releases of benchee (0.6.0 – Changelog), benchee_csv (0.5.0 – Changelog) as well as the initial releases of benchee_html and benchee_json!

I’m the proudest and happiest of finally getting benchee_html out of the door along with great HTML reports including plenty of graphs and the ability to export them! You can check out the example online report or glance at this screenshot of it:

reportWhile benchee_csv had some mere updates for compatibility and benchee_json just transforms the general suite to JSON (which is then used in the HTML formatter) I’m particularly excited about the big new features in benchee and of course benchee_html!

Benchee

The 0.6.0 is probably the biggest release of the “core” benchee library with some needed API changes and great features.

New run API – options last as keyword list

The “old” way you’d optionally pass in options as the first argument into run as a map and then define the jobs to benchmark in another map. I did this because in my mind the configuration comes first and maps are much easier to work with through pattern matching as opposed to keyword lists. However, having an optional first argument already felt kind of weird…

Thing is, that’s not the most elixir way to do this. It is rather conventional to pass in options as the last argument and as a keyword list. After voicing my concerns in the elixirforum, the solution was to allow passing in options as keyword lists but convert to maps internally to still have the advantage of good pattern matching among other advantages.


list = Enum.to_list(1..10_000)
map_fun = fn(i) -> [i, i * i] end
Benchee.run(%{
"flat_map" => fn -> Enum.flat_map(list, map_fun) end,
"map.flatten" => fn -> list |> Enum.map(map_fun) |> List.flatten end
},
formatters: [
&Benchee.Formatters.HTML.output/1,
&Benchee.Formatters.Console.output/1
],
html: [file: "samples_output/flat_map.html"],
)

view raw

new_run.exs

hosted with ❤ by GitHub

The old style still works (thanks to pattern matching!) – but it might get deprecated in the future. In this process though the run interface of the very first version of run, which used a list of tuples, doesn’t work anymore 😦

Multiple inputs

The great new feature is that benchee now supports multiple inputs – so that in one suite you can run the same functions against multiple different inputs. That is important as functions can behave very differently on inputs of different sizes or a different structure. Therefore it’s good to check the functions against multiple inputs. The feature was inspired by a discussion on an elixir issue with José Valim.

So what does this look like? Here it goes:


map_fun = fn(i) -> [i, i * i] end
Benchee.run(%{
"flat_map" => fn(input) -> Enum.flat_map(input, map_fun) end,
"map.flatten" => fn(input) -> input |> Enum.map(map_fun) |> List.flatten end
},
inputs: %{
"Small" => Enum.to_list(1..1000),
"Bigger" => Enum.to_list(1..100_000)
})


Erlang/OTP 19 [erts-8.1] [64-bit] [smp:8:8] [async-threads:10] [hipe] [kernel-poll:false]
Elixir 1.3.4
Benchmark suite executing with the following configuration:
warmup: 2.0s
time: 5.0s
parallel: 1
inputs: Bigger, Small
Estimated total run time: 28.0s
Benchmarking with input Bigger:
Benchmarking flat_map…
Benchmarking map.flatten…
Benchmarking with input Small:
Benchmarking flat_map…
Benchmarking map.flatten…
##### With input Bigger #####
Name ips average deviation median
map.flatten 139.35 7.18 ms ±8.86% 7.06 ms
flat_map 70.91 14.10 ms ±18.04% 14.37 ms
Comparison:
map.flatten 139.35
flat_map 70.91 – 1.97x slower
##### With input Small #####
Name ips average deviation median
map.flatten 18.14 K 55.13 μs ±9.31% 54.00 μs
flat_map 10.65 K 93.91 μs ±8.70% 94.00 μs
Comparison:
map.flatten 18.14 K
flat_map 10.65 K – 1.70x slower

view raw

result

hosted with ❤ by GitHub

The hard thing about it was that it changed how benchmarking results had to be represented internally, as another level to represent the different inputs was needed. This lead to quite some work both in benchee and in plugins – but in the end it was all worth it 🙂

benchee_html

This has been in the making for way too long, should have released a month or 2 ago. But now it’s here! It provides a nice HTML table and four different graphs – 2 for comparing the different benchmarking jobs and 2 graphs for each individual job to take a closer look at the distribution of run times of this particular job. There is a wiki page at benchee_html to discern between the different graphs highlighting what they might be useful for. You can also export PNG images of the graphs at click of a simple icon 🙂

Wonder how to use it? Well it was already shown earlier in this post when showing off the new API. You just specify the formatters and the file where it should be written to 🙂

But without further ado you can check out the sample report or just take a look at these images 🙂

ipsboxplothistogram

raw_run_timesClosing Thoughts

Hope you enjoy benchmarking, with different inputs and then see great reports of them. Let me know what you like about benchee or what you don’t like about it and what could be better.

Benchee 0.4.0 released – adjust what is printed

Today I made a little 0.4.0 release of my elixir benchmarking library benchee. As always the Changelog has all the details.

This release mainly focusses on making all non essential output that benchee produces optional. This is mostly rooted in user feedback of people who wanted to disable the fast execution warnings or the comparison report. I decided to go full circle and also make it configurable if benchee prints out which job it is currently benchmarking or if the general configuration information is printed. I like this sort of verbose information and progress feedback – but clearly it’s not to everyone’s taste and that’s just fine 🙂

So what’s next for benchee? As a keen github observer might have noticed I’ve taken a few stabs at rendering charts in HTML + JS for benchee and in the process created benchee_json. I’m a bit dissatisfied as of now, as I’d really want to have graphs showing error bars and that seems to be harder to come by than I thought. After D3 and chart.js I’ll probably give highcharts a stab now. However, just reading the non-commercial terms again I’m not too sure if it’s good in all sense (e.g. what happens if someone in a commercial corporation uses and generates the HTML?). Oh, but the wonders of the Internet in a new search I found plotly which seems to have some great error bars support.

Other future plans include benchmarking with multiple input sizes to see how different approaches perform or the good old topic of lessening the impact of garbage collection 🙂


Benchee 0.3.0 released – formatters, parallel benchmarking & more

Yesterday I released benchee 0.3.0! Benchee is a tool for (micro) benchmarking in elixir focussing on being simple, extensible and to provide you with good statistics. You can refer to the Changelog for detailed information about the changes. This post will look at the bigger changes and also give a bit of the why for the new features and changes.

Multiple formatters

Arguably the biggest feature in Benchee 0.3.0 is that it is now easy and built-in to configure multiple formatters for a benchmarking suite. This means that first the benchmark is run, and then multiple formatters are run on the benchmarking results. This way you can get both the console output and the corresponding csv file using BencheeCSV. This was a pain point for me before, as you could either get one or the other or you needed to use the more verbose API.


list = Enum.to_list(1..10_000)
map_fun = fn(i) -> [i, i * i] end
Benchee.run(
%{
formatters: [
&Benchee.Formatters.CSV.output/1,
&Benchee.Formatters.Console.output/1
],
csv: %{file: "my.csv"}
},
%{
"flat_map" => fn -> Enum.flat_map(list, map_fun) end,
"map.flatten" => fn -> list |> Enum.map(map_fun) |> List.flatten end
})

You can also see the new output/1 methods at work, as opposed to format/1 they also really do the output themselves. BencheeCSV uses a custom configuration options to know which file to write to. This is also new, as now formatters have access to the full benchmarking suite, including configuration, raw run times and function definitions. This way they can be configured using configuration options they define themselves, or a plugin could graph all run times if it wanted to.

Of course, formatters default to just the built-in console formatter.

Parallel benchmarking

Another big addition is parallel benchmarking. In Elixir, this just feels natural to have. You can specify a parallel key in the configuration and that tells Benchee how many tasks should execute any given benchmarking job in parallel.


list = Enum.to_list(1..10_000)
map_fun = fn(i) -> [i, i * i] end
Benchee.run(%{time: 3, parallel: 2}, %{
"flat_map" => fn -> Enum.flat_map(list, map_fun) end,
"map.flatten" => fn -> list |> Enum.map(map_fun) |> List.flatten end
})

Of course, if you want to see how a system behaves under load – overloading might be exactly what you want to stress test the system. And this was exactly the reason why Leon contributed this change back to Benchee:

I needed to benchmark integration tests for a telephony system we wrote – with this system the tests actually interfere with each other (they’re using an Ecto repo) and I wanted to see how far I could push the system as a whole. Making this small change to Benchee worked perfectly for what I needed 🙂

(Of course it makes me extremely happy that people found adjusting Benchee for their use case simple, that’s one of the main goals of Benchee. Even better that it was contributed back ❤ )

If you want to see more information and detail about “to benchmark in parallel or not” you can check the Benchee wiki. Spoiler alert: The more parallel benchmarks run, the slower they get to an acceptable degree until the system is overloaded (more tasks execute in parallel than there are CPU cores to take care of them). Also deviation skyrockets.

While the effect seems not to be very significant for parallel: 2 on my system, the default in Benchee remains parallel: 1 for the mentioned reasons.

Print configuration information

Partly also due to the parallel change, Benchee wil now print a brief summary of the benchmarking suite before executing it.


tobi@happy ~/github/benchee $ mix run samples/run_parallel.exs

Benchmark suite executing with the following configuration:
warmup: 2.0s
time: 3.0s
parallel: 2
Estimated total run time: 10.0s

Benchmarking flat_map...
Benchmarking map.flatten...

Name                  ips        average    deviation         median
map.flatten       1268.15       788.55μs    (±13.94%)       759.00μs
flat_map           706.35      1415.72μs     (±8.56%)      1419.00μs

Comparison:
map.flatten       1268.15
flat_map           706.35 - 1.80x slower

This was done so that when people share their benchmarks online one can easily see the configuration they ran it with. E.g. was there any warmup time? Was the amount of parallel tasks too high and therefore the results are that bad?

It also prints an estimated total run time (number of jobs * (warmup + time)), so you know if there’s enough time to go and get a coffee before a benchmark finishes.

Map instead of a list of tuples

What is also marked as a “breaking” change in the Changelog is actually not THAT breaking. The main data structure handed to Benchee.run was changed to a map instead of a list of tuples and all corresponding data structures changed as well (important for plugins to know).

It used to be a list of tuples because of the possibility that benchmarks with the same name would override each other. However, having benchmarks with the same name is nonsensical as you can’t discern their results in the output any way. So, this now feels like a much more fitting data structure.

The old main data structure of a list of tuples still works and while I might remove it, I don’t expect me to right now as all that is required to maintain it is 4 lines of code. This makes duplicated names no longer working the only real deprecation, although one might even call it a feature 😉

Last, but not least, this release is the first one that got some community contributions in, which makes me extremely happy. So, thanks Alvin and Leon! 😀

Benchee 0.2.0 – warmup & nicer console output

Less than a week after the initial release of my benchmarking library Benchee there is a new version – 0.2.0! The details are in the Changelog. That’s the what, but what about the why?

Warmup

Arguably the biggest change is introduction of a warmup phase to the benchmarks. That is the benchmark jobs are first run for some time without taking measurements to simulate a “warm” already running system. I didn’t think it’d be that important as the BEAM VM isn’t JITed (as opposed to the JVM) for all hat I know. It is important once benchmarks get to be “macro” – for instance databases usually respond faster once they got used to some queries and our webservers serve most of their time “hot”.

However, even in my micro benchmarks I noticed that it could have an effect when a benchmark was moved around (being run first versus being run last). So I don’t know to what effect, but at least to a small effect there is warmup now. If you don’t want warmup – just set warmup: 0.

Nicer console output

Name                                    ips        average    deviation         median
bodyrecusrive map                  40047.87        24.97μs    (±32.55%)        25.00μs
stdlib map                         39724.07        25.17μs    (±61.41%)        25.00μs
map tco no reverse                 36388.50        27.48μs    (±23.22%)        27.00μs
map with TCO and reverse           33309.43        30.02μs    (±45.39%)        29.00μs
map with TCO and ++                  465.25      2149.40μs     (±4.84%)      2138.00μs

Comparison: 
bodyrecusrive map                  40047.87
stdlib map                         39724.07 - 1.01x slower
map tco no reverse                 36388.50 - 1.10x slower
map with TCO and reverse           33309.43 - 1.20x slower
map with TCO and ++                  465.25 - 86.08x slower

The ouput of numbers is now aligned right, which makes them easier to read and compare, as you can see orders of magnitude differences much more easily. Also the ugly empty line at the end of the output has been removed 🙂

Benchee.measure

This is the API incompatible change. It felt weird to me in version 0.1.0 that Benchee.benchmark would already run the function given to it. Now the jobs are defined through Benchee.benchmark and kept in a datastructure (similar to the one Benchee.run uses). Benchee.measure then runs the jobs and measures the outcome and provides them under the new run_times key instead of overriding the jobs key. This feels much nicer overall, of course the high level Benchee.run is unaffected by this.

These additions already nicely improve what Benchee can do and got a couple of items off my “I want to do this in benchee” bucket list. There’s still more to come 🙂

Introducing Benchee: simple and extensible benchmarking for Elixir

If you look around this blog it becomes pretty clear that I really love (micro) benchmarking. Naturally, while working more and more with Elixir (and loving it!) I wanted to benchmark something. Sadly, the existing options I found didn’t quite satisfy me. Be it for a different focus, missing statistics, lacking documentation or other things. So I decided to roll my own, it’s not like it’d be the first time.

Of course I tried extending existing solutions but very long functions, very scarce test coverage, lots of dead and outcommented code and a rotting PR later I decided it was time to create something new. So without further ado, please meet Benchee (of course available on hex)!

What’s great about Benchee?

Benchee is easy to use, well documented and can be extended (more on that in the following paragraphs). Benchee will run each benchmarking function you give it for a given amount of time and then compute statistics from it. Statistics is where it shines in my opinion. Benchee provides you with:

  • average run time (ok – yawn)
  • iterations per second, which is great for graphs etc. as higher is better here (as opposed to average run time)
  • standard deviation, an important value in my opinion as it gives you a feeling for how certain you can be about your measurements and how much they vary. Sadly, none of the elixir benchmarking tools I looked at supplied this value.
  • median, it’s basically the middle value of your distribution and is often cited as a value that reflects the “common” outcome better than average as it cuts out outliers. I never used a (micro) benchmarking tool that provided this value, but was often asked to provide it in my benchmarks. So here it is!

Also it gives a rather nice output on the console with headers so you know what is what. An example is further down but for now let’s talk design…

Designing a Benchmarking library

The design is influenced by my favourite ruby benchmarking library: benchmark-ips. Of course I wanted it to be more of an elixirish spin and offer more options.

A lot of elixir solutions used macros. I wanted something that works purely with functions, no tricks. When I started to learn more about functional programming one of the things that stuck with me the most was that functional programming is about a series of transformations. So what do these transformations look like for benchmarking?

  1. Create a basic benchmarking configuration with things like how long should the benchmark run, should GC be enabled etc.
  2. Run individual benchmarks and record their raw execution times
  3. Compute statistics based on these raw run times per benchmark
  4. Format the statistics to be suitable for output
  5. Put out the formatted statistics to the console, a file or whatever

So what do you now, that’s exactly what the API of Benchee looks like!


list = Enum.to_list(1..10_000)
map_fun = fn(i) -> [i, i * i] end

Benchee.init(%{time: 3})
|> Benchee.benchmark("flat_map", fn -> Enum.flat_map(list, map_fun) end)
|> Benchee.benchmark("map.flatten",
                     fn -> list |> Enum.map(map_fun) |> List.flatten end)
|> Benchee.statistics
|> Benchee.Formatters.Console.format
|> IO.puts

What’s great about this? Well it’s super flexible and flows nicely with the beloved elixir pipe operator.

Why is this flexible and extensible? Well, don’t like how Benchee runs the benchmarks? Sub in your own benchmarking function! Want more/different statistics? Go use your own function and compute your own! Want results to be displayed in a different format? Roll you own formatter! Or you just want to write the results to a file? Well, go ahead!

This is more than just cosmetics. It’d be easy to write a plugin that converts the results to some JSON format and then post them to a web service to gather benchmarking results or let it generate fancy graphs for you.

Of course, not everybody needs that flexibility. Some people might be scared away by the verboseness above. So there’s also a higher level interface that uses all the options you see above and condenses them down to one function call to efficiently define your benchmarks:

list = Enum.to_list(1..10_000)
map_fun = fn(i) -> [i, i * i] end

Benchee.run(%{time: 3},
             [{"flat_map", fn -> Enum.flat_map(list, map_fun) end},
              {"map.flatten",
              fn -> list |> Enum.map(map_fun) |> List.flatten end}])

Let’s see some results!

You’ve seen two different ways to run the same benchmark with Benchee now, so what’s the result and what does it look like? Well here you go:

tobi@happy ~/github/benchee $ mix run samples/run.exs
Benchmarking flat_map...
Benchmarking map.flatten...

Name                          ips            average        deviation      median
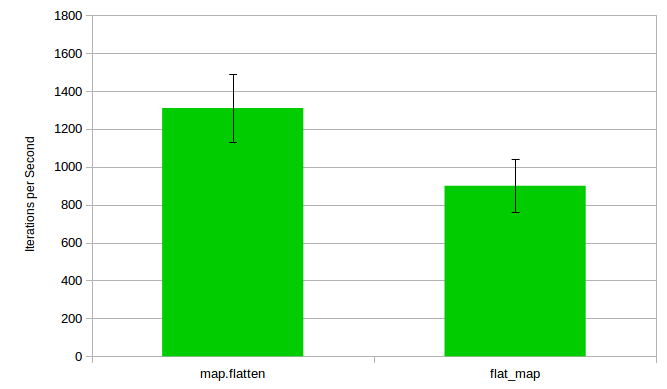
map.flatten                   1311.84        762.29μs       (±13.77%)      747.0μs
flat_map                      896.17         1115.86μs      (±9.54%)       1136.0μs

Comparison:
map.flatten                   1311.84
flat_map                      896.17          - 1.46x slower

So what do you know, much to my own surprise calling map first and then flattening the result is significantly faster than a one pass flat_map. Which is unlike ruby, where flat_map is over two times fast in the same scenario. So what does that tell us? Well, what we think about performance from other programming languages might not hold true. Also, that there might be a bug in flat_map – it should be faster for all that I know. Need some time to investigate 🙂

All that aside, wouldn’t a graph be nice? That’s a feature I envy benchfella for. But wait, we got this whole extensible architecture right? Generating the whole graph myself with error margins etc. might be a bit tough, though. But I got LibreOffice on my machine. A way to quickly feed my results into it would be great.

Meet BencheeCSV (the first and so far only Benchee plugin)! With it we can substitute the formatting and output steps to generate a CSV file to be consumed by a spreadsheet tool of our choice:

file = File.open!("test.csv", [:write])
list = Enum.to_list(1..10_000)
map_fun = fn(i) -> [i, i * i] end

Benchee.init
|> Benchee.benchmark("flat_map", fn -> Enum.flat_map(list, map_fun) end)
|> Benchee.benchmark("map.flatten",
                     fn -> list |> Enum.map(map_fun) |> List.flatten end)
|> Benchee.statistics
|> Benchee.Formatters.CSV.format
|> Enum.each(fn(row) -> IO.write(file, row) end)

And a couple of clicks later there is a graph including error margins:

benchee_csv

How do I get it?

Well, just add benchee or benchee_csv to the deps of your mix.exs!

def deps do
  [{:benchee, "~> 0.1.0", only: :dev}]
end

Then run mix deps.get, create a benchmarking folder and create your new my_benchmark.exs! More information can be found in the online documentation or at the github repository.

Anything else?

Well Benchee tries to help you, that’s why when you try to micro benchmark an extremely fast function you might happen upon this beauty of a warning:

Warning: The function you are trying to benchmark is super fast, making time measures unreliable!
Benchee won’t measure individual runs but rather run it a couple of times and report the average back. Measures will still be correct, but the overhead of running it n times goes into the measurement. Also statistical results aren’t as good, as they are based on averages now. If possible, increase the input size so that an individual run takes more than 10μs

The reason why I put it there is pretty well explained. The measurements would simply be unreliable as randomness and the measuring itself have too huge of an impact. Plus, measurements are in micro seconds – so it’s not that accurate either. I tried nano seconds but quickly discarded them as that seemed to add even more overhead.

Benchee tries to run your benchmark n times then and measure that, while it improves the situation somewhat it adds the overhead of my repeat_n function to the benchmark.

So if you can, please benchmark with higher values 🙂

Ideas for the future?

Benchee is just version 0.1.0, but a lot of work, features and thought has already gone into it. Here are features that I thought about but decided they are not necessary for a first release:

  • Turning off/reducing garbage collection: Especially micro benchmarking can be affected by garbage collection as single runs will be much slower than the others leading to a sky rocketing standard deviation and unreliable measures. Sadly,  to the best of my knowledge, one can’t turn off GC on the BEAM. But people have shown me options where I could just set a very high memory space to reduce the chance of GC. Need to play with it.
  • Auto scaling units: It’d be nice to for instance show the average time in milliseconds if a benchmark is slower or write something to the effect of “80.9 Million” iterations per second for the console output for a fast benchmark.
  • Better alignment for console output. Right now it’s left aligned, I think right alignment looks better and helps compare results.
  • Making sure Benchee is also usable for more macro benchmarks, e.g. functions that run in the matter of seconds or even minutes
  • Correlating to that, also provide the option to specify a warmup time. Elixir/Erlang isn’t JITed so it should have no impact there, but for macro benchmarks on phoenix or so with the database it should have an impact.
  • Give measuring memory consumption a shot
  • More statistics: Anything you are missing, wishing for?
  • Graph generation: A plugin to generate and share a graph right away would be nice
  • Configurable steps in Benchee.run: Right now if you want to use a plugin you have to use the more “verbose” API of Benchee. If Benchee gains traction and plugins really become a thing it’d be nice to configure them in the high level API like %{formatter: MyFormatModule} or %{formatter: MyFormatModule.format/1}.

So that’s it – have anything you’d like to see in Benchee? Please get in touch and let me know! In any case, give Benchee a try and happy benchmarking!