The great Rubykon Benchmark 2020: CRuby vs JRuby vs TruffleRuby

It has been far too long, more than 3.5 years since the last edition of this benchmark. Well what to say? I almost had a new edition ready a year ago and then the job hunt got too intense and now the heat wave in Berlin delayed me. You don’t want your computer running at max capacity for an extended period, trust me.

Well, you aren’t here to hear about why there hasn’t been a new edition in so long, you’re here to read about the new edition! Most likely you’re here to look at graphs and see what’s the fastest ruby implementation out there. And I swear we’ll get to it but there’s some context to establish first. Of course, feel free to skip ahead if you just want the numbers.

Well, let’s do this!

What are we benchmarking?

We’re benchmarking Rubykon again, a Go AI written in Ruby using Monte Carlo Tree Search. It’s a fun project I wrote a couple of years back. Basically it does random playouts of Go games and sees what moves lead to a winning game building a tree with different game states and their win percentages to select the best move.

Why is this a good problem to benchmark? Performance matters. The more playouts we can do the better our AI plays because we have more data for our decisions. The benchmark we’re running starts its search from an empty 19×19 board (biggest “normal” board) and does 1000 full random playouts from there. We’ll measure how long that takes/how often we could do that in a minute. This also isn’t a micro benchmark, while remaining reasonable in size it looks at lots of different methods and access patterns.

Why is this a bad problem to benchmark? Most Ruby devs are probably interested in some kind of web application performance. This does no IO (which keeps the focus on ruby code execution, which is also good) and mainly deals with arrays. While we deal with collections all the time, rubykon also accesses a lot of array indexes all over, which isn’t really that common. It also barely deals with strings. Moreover, it does a whole lot of (pseudo-)random number generation which definitely isn’t a common occurrence. It also runs a relatively tight hot loop of “generate random valid move, play it, repeat until game over”, which should be friendly to JIT approaches.

What I want to say, this is an interesting problem to benchmark but it’s probably not representative of web application performance of the different ruby implementations. It is still a good indicator of where different ruby implementations rank performance wise.

It’s also important to note that this benchmark is single threaded – while it is a problem suited for parallelization I haven’t done so yet. Plus, single threaded applications are still typical for Ruby (due to the global interpreter lock in CRuby).

We’re also mainly interested in “warm” application performance i.e. giving them a bit of time to warm up and look at their peak performance. We’ll also look at the warmup times in a separate section though.

The competitors

Our competitors are ruby variants I could easily install on my machine and was interested in which brings us to:

  • CRuby 2.4.10
  • CRuby 2.5.8
  • CRuby 2.6.6
  • CRuby 2.7.1
  • CRuby 2.8.0-dev (b4b702dd4f from 2020-08-07) (this might end up being called Ruby 3 not 2.8)
  • truffleruby-1.0.0-rc16
  • truffleruby-20.1.0
  • jruby-9.1.17.0
  • jruby-9.2.11.1

All of those versions were current as of early August 2020. As usual doing all the benchmarking, graphing and writing has taken me some time so that truffleruby released a new version in the mean time, result shouldn’t differ much though.

CRuby (yes I still insist on calling it that vs. MRI) is mainly our base line as it’s the standard ruby interpreter. Versions that are capable of JITing (2.6+) will also be run with the –jit flag separately to show improvement (also referred to as MJIT).

TruffleRuby was our winner the last 2 times around. We’re running 20.1 and 1.0-rc16 (please don’t ask me why this specific version, it was in the matrix from when I originally redid this benchmarks a year ago). We’re also going to run both native and JVM mode for 20.1.

JRuby will be run “normally”, and with invokedynamic + server flag (denoted by “+ID”). We’re also gonna take a look at JDK 8 and JDK 14. For JDK 14 we’re also going to run it with a non default GC algorithm, falling back to the one used in JDK 8 as the new default is slower for this benchmark. Originally I also wanted to run with lots of different JVMs but as it stands I already recorded almost 40 different runs in total and the JVMs I tried didn’t show great differences so we’ll stick with the top performer of those I tried which is AdoptOpenJDK.

You can check all flags passed etc. in the benchmark script.

The Execution Environment

This is still running on the same Desktop PC that I did the first version of these benchmarks with – almost 5 years ago. In the meantime it was hit by a lot of those lovely intel security vulnerabilities though. It’s by no means a top machine any more.

The machine has 16 GB of RAM, runs Linux Mint 19.3 (based on Ubuntu 18.04 LTS) and most importantly an i7-4790 (3.6 GHz, 4 GHz boost) (which is more than 6 years old now).

tobi@speedy:~$ uname -a
Linux speedy 5.4.0-42-generic #46~18.04.1-Ubuntu SMP Fri Jul 10 07:21:24 UTC 2020 x86_64 x86_64 x86_64 GNU/Linux
tobi@speedy:~$ lscpu
Architecture: x86_64
CPU op-mode(s): 32-bit, 64-bit
Byte Order: Little Endian
CPU(s): 8
On-line CPU(s) list: 0-7
Thread(s) per core: 2
Core(s) per socket: 4
Socket(s): 1
NUMA node(s): 1
Vendor ID: GenuineIntel
CPU family: 6
Model: 60
Model name: Intel(R) Core(TM) i7-4790 CPU @ 3.60GHz
Stepping: 3
CPU MHz: 3568.176
CPU max MHz: 4000,0000
CPU min MHz: 800,0000
BogoMIPS: 7200.47
Virtualization: VT-x
L1d cache: 32K
L1i cache: 32K
L2 cache: 256K
L3 cache: 8192K
NUMA node0 CPU(s): 0-7
Flags: fpu vme de pse tsc msr pae mce cx8 apic sep mtrr pge mca cmov pat pse36 clflush dts acpi mmx fxsr sse sse2 ss ht tm pbe syscall nx pdpe1gb rdtscp lm constant_tsc arch_perfmon pebs bts rep_good nopl xtopology nonstop_tsc cpuid aperfmperf pni pclmulqdq dtes64 monitor ds_cpl vmx smx est tm2 ssse3 sdbg fma cx16 xtpr pdcm pcid sse4_1 sse4_2 x2apic movbe popcnt tsc_deadline_timer aes xsave avx f16c rdrand lahf_lm abm cpuid_fault epb invpcid_single pti ssbd ibrs ibpb stibp tpr_shadow vnmi flexpriority ept vpid ept_ad fsgsbase tsc_adjust bmi1 avx2 smep bmi2 erms invpcid xsaveopt dtherm ida arat pln pts md_clear flush_l1d
view raw system_info hosted with ❤ by GitHub

All background applications were closed and while the benchmarks were running no GUI was active. They were run on hot Berlin evenings 😉

If you want to run these benchmarks yourself the rubykon repo has the instructions, with most of it being automated.

Timing wise I chose 5 minutes of warmup and 2 minutes of run time measurements. The (enormous) warmup time was mostly driven by behaviour observed in TruffleRuby where sometimes it would deoptimize even after a long warmup. So, I wanted to make sure everyone had all the time they needed to reach good “warm” performance.

Run Time Results

One more thing before we get to it: JRuby here ran on AdoptOpenJDK 8. Differences to AdoptOpenJDK 14 (and other JVMs) aren’t too big and would just clutter the graphs. We’ll take a brief look at them later.

If you want to take a look at all the data I gathered you can access the spreadsheet.

Iterations per Minute per Ruby implementation for running 1000 full playouts on a 19×19 board (higher is better).

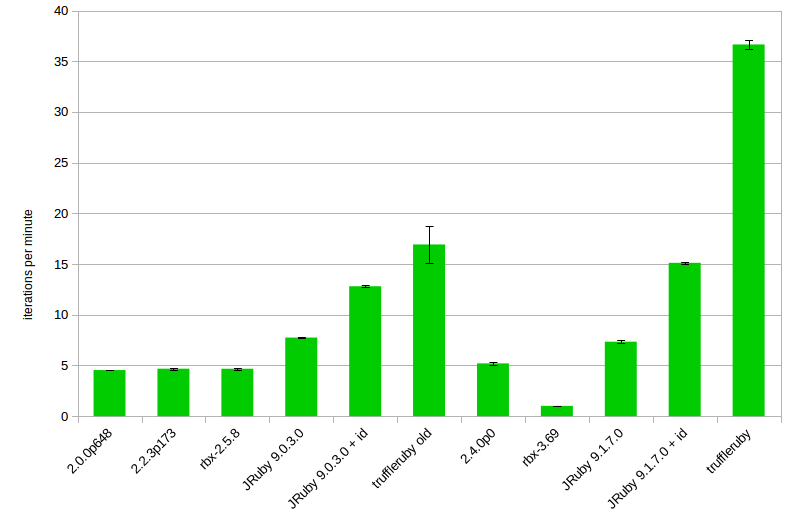
Overall this looks more or less like the graphs from the last years:

  • CRuby is the baseline performance without any major jumps
  • JRuby with invokedynamic (+ID) gets a bit more than 2x the baseline performance of CRuby, invokedynamic itself makes it a lot faster (2x+)
  • TruffleRuby runs away with the win

What’s new though is the inclusion of the JIT option for CRuby which performs quite impressively and is only getting better. An 18% improvement on 2.6 goes up to 34% on 2.7 and tops out at 47% for 2.8 dev when looking at the JIT vs. non JIT run times of the same Ruby version. Looking at CRuby it’s also interesting that this time around “newer” CRuby performance is largely on par with not JITed JRuby performance.

The other thing that sticks out quite hugely are those big error bars on TruffleRuby 20. This is caused by some deoptimizations even after the long warmup. Portrayed here is a run where they weren’t as bad, even if they are worse performance was still top notch at 27 i/min overall though. It’s most likely a bug that these deoptimizations happen, you can check the corresponding issue. In the past the TruffleRuby always found a way to fix issues like this. So, the theoretical performance is a bit higher.

Another thing I like to look at is the relative speedup chart:

Speedup relative to CRuby 2.4.10 (baseline)

CRuby 2.4.10 was chosen as the “baseline” for this relative speedup chart mostly as a homage to Ruby 3×3 in which the goal was for Ruby 3 to be 3 times faster than Ruby 2.0. I can’t get Ruby < 2.4 to compile on my system easily any more and hence they are sadly missing here.

I’m pretty impressed with the JIT in Ruby 2.8: a speedup of over 60% is not to be scoffed at! So, as pointed out in the results above, I have ever rising hopes for it! JRuby (with invokedynamic) sits nice and comfortably at ~2.5x speedup which is a bit down from its 3x speedup in the older benchmarks. This might also be to the improved baseline of CRuby 2.4.10 versus the old CRuby 2.0 (check the old blog post for some numbers from then, not directly comparable though). TruffleRuby sits at the top thanks to the –jvm version with almost a 6x improvement. Perhaps more impressively it’s still 2.3 times faster than the fastest non TruffleRuby implementation. The difference between “native” and –jvm for TruffleRuby is also astounding and important to keep in mind should you do your own benchmarks.

What’s a bit baffling is that the performance trend for CRuby isn’t “always getting better” like I’m used to. The differences are rather small but looking at the small standard deviation (at most less than 1%) I’m rather sure of them. 2.5 is slower than 2.4, and 2.6 is faster than both 2.7 and 2.8.-dev. However, the “proper” order is established again when enabling the JIT.

If you’re rather interested in the data table you can still check out the spreadsheet for the full data, but here’s some of it inline:

Rubyi/minavg (s)stddev %relative speedup
2.4.105.6110.690.861
2.5.85.1611.630.270.919786096256684
2.6.66.619.080.421.17825311942959
2.6.6 –jit7.87.690.591.3903743315508
2.7.16.459.30.251.14973262032086
2.7.1 –jit8.646.950.291.54010695187166
2.8.0-dev6.289.560.321.11942959001783
2.8.0-dev –jit9.256.480.291.64884135472371
truffleruby-1.0.0-rc1616.553.632.192.95008912655971
truffleruby-20.1.020.222.9725.823.60427807486631
truffleruby-20.1.0 –jvm33.321.819.015.93939393939394
jruby-9.1.17.06.529.210.631.16221033868093
jruby-9.1.17.0 +ID14.274.20.292.54367201426025
jruby-9.2.11.16.339.490.541.1283422459893
jruby-9.2.11.1 +ID13.854.330.442.46880570409982

Warmup

Seems the JITing approaches are winning throughout, however such performance isn’t free. Conceptually, a JIT looks at what parts of your code are run often and then tries to further optimize (and often specialize) these parts of the code. This makes it a whole lot faster, this process takes time and work though.

The benchmarking numbers presented above completely ignore the startup and warmup time. The common argument for this is that in long lived applications (like most web applications) we spend the majority of time in the warmed up/hot state. It’s different when talking about scripts we run as a one off. I visualized and described the different times to measure way more in another post.

Anyhow, lets get a better feeling for those warmup times, shall we? One of my favourite methods for doing so is graphing the first couple of run times as recorded (those are all during the warmup phase):

Run times as recorded by iteration number for a few select Ruby implementations. Lower is faster/better.
Same data as above but as a line chart. Thanks to Stefan Marr for nudging me.

CRuby itself (without –jit) performs at a steady space, this is expected as no further optimizations are done and there’s also no cache or anything involved. Your first run is pretty much gonna be as fast as your last run. It’s impressive to see though that the –jit option is faster already in the first iteration and still getting better. What you can’t see in the graph, as it doesn’t contain enough run times and the difference is very small, is that the CRuby –jit option only reaches its peak performance around iteration 19 (going from ~6.7s to ~6.5s) which is quite surprising looking at how steady it seems before that.

TruffleRuby behaves in line with previous results. It has by far the longest warmup time, especially the JVM configuration which is in line with their presented pros and cons. The –jvm runtime configuration only becomes the fastest implementation by iteration 13! Then it’s faster by quite a bit though. It’s also noteworthy that for neither native nor JVM the time declines steadily. Sometimes subsequent iterations are slower which is likely due to the JIT trying hard to optimize something or having to deoptimize something. The random nature of Rubykon might play into this, as we might be hitting edge cases only at iteration 8 or so. While especially the first run time can be quite surprising, it’s noteworthy that during my years of doing these benchmarks I’ve seen TruffleRuby steadily improve its warmup time. As a datapoint, TruffleRuby 1.0.0-rc16 had its first 2 run times at 52 seconds and 25 seconds.

JRuby is very close to peak performance after one iteration already. Peak performance with invokedynamic is hit around iteration 7. It’s noteworthy that with invokedynamic even the first iteration is faster than CRuby “normal” and on par with the CRuby JIT implementation but in subsequent iterations gets much faster than them. The non invokedynamic version is very close to normal CRuby 2.8.0-dev performance almost the entire time, except for being slower in the first iteration.

For context it’s important to point out though that Rubykon is a relatively small application. Including the benchmarking library it’s not even 1200 lines of code long. It uses no external gems, it doesn’t even access the standard library. So all of the code is in these 1200 lines + the core Ruby classes (Array etc.) which is a far cry from a full blown Rails application. More code means more things to optimize and hence should lead to much longer warmup times than presented here.

JRuby/JVM musings

It might appear unfair that the results up there were run only with JDK 8. I can assure you, in my testing it sadly isn’t. I had hoped for some big performance jumps with the new JDK versions but I found no such thing. Indeed, it features the fastest version but only by a rather slim margin. It also requires switching up the GC algorithm as the new default performs worse at least for this benchmark.

Comparison JRuby with different options against AdoptOpenJDK 8 and 14

Performance is largely the same. JDK 14 is a bit faster when using both invokedynamic and falling back to the old garbage collector (+ParallelGC). Otherwise performance is worse. You can find out more in this issue. It’s curios though that JRuby 9.1 seems mostly faster than 9.2.

I got also quite excited at first looking at all the different new JVMs and thought I’d benchmark against them all, but it quickly became apparent that this was a typical case of “matrix explosion” and I really wanted for you all to also see these results unlike last year 😅 I gathered data for GraalVM and Java Standard Edition Reference Implementation in addition to AdoptOpenJDK but performance was largely the same and best at AdoptOpenJDK on my system for this benchmark. Again, these are in the spreadsheet.

I did one more try with OpenJ9 as it sounded promising. The results were so bad I didn’t even put them into the spreadsheet (~4 i/min without invokedynamic, ~1.5 i/min with invokedynamic). I can only imagine that either I’m missing a magic switch, OpenJ9 wasn’t built with a use case such as JRuby in mind or JRuby isn’t optimized to run on OpenJ9. Perhaps all of the above.

Final Thoughts

Alright, I hope this was interesting for y’all!

What did we learn? TruffleRuby still has the best “warm” performance by a mile, warmup is getting better but can still be tricky (–> unexpected slowdowns late into the process). The JIT for CRuby seems to get better continuously and has me a bit excited. CRuby performance has caught up to JRuby out of the box (without invokedynamic). JRuby with invokedynamic is still the second fastest Ruby implementation though.

It’s also interesting to see that every Ruby implementation has at least one switch (–jit, –jvm, invokedynamic) that significantly alters performance characteristics.

Please, also don’t forget the typical grain of salt: This is one benchmark, with one rather specific use case run on one machine. Results elsewhere might differ greatly.

What else is there? Promising to redo the benchmark next year would be something, but my experience tells me not to 😉

There’s an Enterprise version of GraalVM with supposedly good performance gains. Now, I won’t be spending money but you can evaluate it for free after registering. Well, if I ever manage to fix my Oracle login and get Oracle’s permission to publish the numbers I might (I’m fairly certain I can get that though 🙂 ). I also heard rumours of some CLI flags to try with TruffleRuby to get even better numbers 🤔

Finally, this benchmark has only looked at run times which is most often the most interesting value. However, there are other numbers that could prove interesting, such as memory consumption. These aren’t as easy to break down so neatly (or I don’t know how to). Showing the maximum amount of memory consumed during the measurement could be helpful though. As some people can tell you, with Ruby it can often be that you scale up your servers due to memory constraints not necessary CPU constraints.

I’d also be interested in how a new PC (planned purchase within a year!) affects these numbers.

So, there’s definitely some future work to be done here. Anything specific you want to see? Please let me know in the comments, via Twitter or however you like. Same goes for new graph types, mistakes I made or what not – I’m here to learn!

Careful what you measure: 2.1 times slower to 4.2 times faster – MJIT versus TruffleRuby

Have you seen the MJIT benchmark results? Amazing, aren’t they? MJIT basically blows the other implementations out of the water! What were they doing all these years? That’s it, we’re done here right?

Well, not so fast as you can infer from the title. But before we can get to what I take issue with in these particular benchmarks (you can of course jump ahead to the nice diagrams) we gotta get some introductions and some important benchmarking basics out of the way.

MJIT? Truffle Ruby? WTF is this?

MJIT currently is a branch of ruby on github by Vladimir Makarov, GCC developer, that implements a JIT (Just In Time Compilation) on the most commonly used Ruby interpreter/CRuby. It’s by no means final, in fact it’s in a very early stage. Very promising benchmarking results were published on the 15th of June 2017, which are in major parts the subject of this blog post.

TruffleRuby is an implementation of Ruby on the GraalVM by Oracle Labs. It poses impressive performance numbers as you can see in my latest great “Ruby plays Go Rumble”. It also implements a JIT, is known to take a bit of a warmup but comes out being ~8 times faster than Ruby 2.0 in the previously mentioned benchmark.

Before we go further…

I have enormous respect for Vladimir and think that MJIT is an incredibly valuable project. Realistically it might be one of our few shots to get a JIT into mainstream ruby. JRuby had a JIT and great performance for years, but never got picked up by the masses (topic for another day).

I’m gonna critique the way the benchmarks were done, but there might be reasons for that, that I’m missing (gonna point out the ones I know). After all, Vladimir has been programming for way longer than I’m even alive and also knows more about language implementations than I do obviously.

Plus, to repeat, this is not about the person or the project, just the way we do benchmarks. Vladimir, in case you are reading this 💚💚💚💚💚💚

What are we measuring?

When you see a benchmark in the wild, first you gotta ask “What was measured?” – the what here comes in to flavors: code and time.

What code are we benchmarking?

It is important to know what code is actually being benchmarked, to see if that code is actually relevant to us or a good representation of a real life Ruby program. This is especially important if we want to use benchmarks as an indication of the performance of a particular ruby implementation.

When you look at the list of benchmarks provided in the README (and scroll up to the list what they mean or look at them) you can see that basically the top half are extremely micro benchmarks:

Selection_041.png

What’s benchmarked here are writes to instance variables, reading constants, empty method calls, while loops and the like. This is extremely micro, maybe interesting from a language implementors point of view but not very indicative of real world ruby performance. The day looking up a constant will be the performance bottle neck in Ruby will be a happy day. Also, how much of your code uses while loops?

A lot of the code (omitting the super micro ones) there isn’t exactly what I’d call typical ruby code. A lot of it is more a mixture of a script and C-code. Lots of them don’t define classes, use a lot of while and for loops instead of the more typical Enumerable methods and sometimes there’s even bitmasks.

Some of those constructs might have originated in optimizations, as they are apparently used in the general language benchmarks. That’s dangerous as well though, mostly they are optimized for one specific platform, in this case CRuby. What’s the fastest Ruby code on one platform can be way slower on the other platforms as it’s an implementation detail (for instance TruffleRuby uses a different String implementation). This puts the other implementations at an inherent disadvantage.

The problem here goes a bit deeper, whatever is in a popular benchmark will inevitably be what implementations optimize for and that should be as close to reality as possible. Hence, I’m excited what benchmarks the Ruby 3×3 project comes up with so that we have some new more relevant benchmarks.

What time are we measuring?

This is truly my favorite part of this blog post and arguably most important. For all that I know the time measurements in the original benchmarks were done like this: /usr/bin/time -v ruby $script which is one of my favorite benchmarking mistakes for programming languages commonly used for web applications. You can watch me go on about it for a bit here.

What’s the problem? Well, let’s analyze the times that make up the total time you measure when you just time the execution of a script: Startup, Warmup and Runtime.

Selection_043.png

  • Startup – the time until we get to do anything “useful” aka the Ruby Interpreter has started up and has parsed all the code. For reference, executing an empty ruby file with standard ruby takes 0.02 seconds for me, MJIT 0.17 seconds and for TruffleRuby it takes 2.5 seconds (there are plans to significantly reduce it though with the help of Substrate VM). This time is inherently present in every measured benchmark if you just time script execution.
  • Warmup – the time it takes until the program can operate at full speed. This is especially important for implementations with a JIT. On a high level what happens is they see which code gets called a lot and they try to optimize this code further. This process takes a lot of time and only after it is completed can we truly speak of “peak performance”. Warmup can be significantly slower than runtime. We’ll analyze the warmup times more further down.
  • Runtime – what I’d call “peak performance” – run times have stabilized. Most/all code has already been optimized by the runtime. This is the performance level that the code will run at for now and the future. Ideally, we want to measure this as 99.99%+ of the time our code will run in a warmed up already started state.

Interestingly, the startup/warmup times are acknowledged in the original benchmark but the way that they are dealt with simply lessens their effect but is far from getting rid of them: “MJIT has a very fast startup which is not true for JRuby and Graal Ruby. To give a better chance to JRuby and Graal Ruby the benchmarks were modified in a way that Ruby MRI v2.0 runs about 20s-70s on each benchmark”.

I argue that in the greater scheme of things, startup and warmup don’t really matter when we are talking about benchmarks when our purpose is to see how they perform in a long lived process.

Why is that, though? Web applications for instance are usually long lived, we start our web server once and then it runs for hours, days, weeks. We only pay the cost of startup and warmup once in the beginning, but run it for a much longer time until we shut the server down again. Normally servers should spend 99.99%+ of their time in the warmed up runtime “state”. This is a fact, that our benchmarks should reflect as we should look for what gives us the best performance for our hours/days/weeks of run time, not for the first seconds or minutes of starting up.

A little analogy here is a car. You wanna go 300 kilometers as fast as possible (straight line). Measuring as shown above is the equivalent of measuring maybe the first ~500 meters. Getting in the car, accelerating to top speed and maybe a bit of time on top speed. Is the car that’s fastest on the first 500 meters truly the best for going 300 kilometers at top speed? Probably not. (Note: I know little about cars)

What does this mean for our benchmark? Ideally we should eliminate startup and warmup time. We can do this by using a benchmarking library written in ruby that also runs the benchmark for a couple of times before actually taking measurements (warmup time). We’ll use my own little library as it means no gem required and it’s well equipped for the rather long run times.

But does startup and warmup truly never matter? It does matter. Most prominently it matters during development time – starting the server, reloading code, running tests. For all of those you gotta “pay” startup and warmup time. Also, if you develop a UI application  or a CLI tool for end users startup and warmup might be a bigger problem, as startup happens way more often. You can’t just warm it up before you take it into the load balancer. Also, running tasks periodically as a cronjob on your server will have to pay theses costs.

So are there benefits to measuring with startup and warmup included? Yes, for one for the use cases mentioned above it is important. Secondly, measuring with time -v gives you a lot more data:


tobi@speedy $ /usr/bin/time -v ~/dev/graalvm-0.25/bin/ruby pent.rb
Command being timed: "/home/tobi/dev/graalvm-0.25/bin/ruby pent.rb"
User time (seconds): 83.07
System time (seconds): 0.99
Percent of CPU this job got: 555%
Elapsed (wall clock) time (h:mm:ss or m:ss): 0:15.12
Average shared text size (kbytes): 0
Average unshared data size (kbytes): 0
Average stack size (kbytes): 0
Average total size (kbytes): 0
Maximum resident set size (kbytes): 1311768
Average resident set size (kbytes): 0
Major (requiring I/O) page faults: 57
Minor (reclaiming a frame) page faults: 72682
Voluntary context switches: 16718
Involuntary context switches: 13697
Swaps: 0
File system inputs: 25520
File system outputs: 312
Socket messages sent: 0
Socket messages received: 0
Signals delivered: 0
Page size (bytes): 4096
Exit status: 0

You get lots of data, among which there’s memory usage, CPU usage, wall clock time and others which are also important for evaluating language implementations which is why they are also included in the original benchmarks.

Setup

Before we (finally!) get to the benchmarks, the obligatory “This is the system I’m running this on”:

The ruby versions in use are MJIT as of this commit from 25th of August compiled with no special settings, graalvm 25 and 27 (more on that in a bit) as well as CRuby 2.0.0-p648 as a baseline.

All of this is run on my Desktop PC running Linux Mint 18.2 (based on Ubuntu 16.04 LTS) with 16 GB of memory and an i7-4790 (3.6 GHz, 4 GHz boost).


tobi@speedy ~ $ uname -a
Linux speedy 4.10.0-33-generic #37~16.04.1-Ubuntu SMP Fri Aug 11 14:07:24 UTC 2017 x86_64 x86_64 x86_64 GNU/Linux

I feel it’s especially important to mention the setup in here, as when I first did these benchmarks for Polyconf on my dual core notebook TruffleRuby had significantly worse results. I think graalvm benefits from the 2 extra cores for warmup etc, as the CPU usage across cores is also quite high.

You can check out the benchmarking script used etc. as part of this repo.

But… you promised benchmarks, where are they?

Sorry, I think the theory is more important than the benchmarks themselves, although they undoubtedly help illustrate the point. We’ll first get into why I chose the pent.rb benchmark as a subject and why I run it with a slightly old versions of graalvm (no worries, current version coming in later on). Then, finally, graphs and numbers.

Why this benchmark?

First of all, the original benchmarks were done with graalvm-0.22. Attempting to reproduce the results with the (at the time current) graalvm-0.25 proved difficult as a lot of them had already been optimized (and 0.22 contained some genuine performance bugs).

One that I could still reproduce the performance problems with was pent.rb and it also seemed like a great candidate to show that something is flawed. In the original benchmarks it is noted down as 0.33 times the performance of Ruby 2.0 (or well, 3 times slower). All my experience with TruffleRuby told me that this is most likely wrong. So, I didn’t choose it because it was the fastest one on TruffleRuby, but rather the opposite – it was the slowest one.

Moreover, while a lot of it isn’t exactly idiomatic ruby code to my mind (no classes, lots of global variables) it uses quite a lot Enumerable methods such as each, collect, sort and uniq while refraining from bitmaskes and the like. So I also felt that it’d make a comparatively good candidate from here.

The way the benchmark is run is basically the original benchmark put into a loop so it is repeated a bunch of times so we can measure the times during warmup and later runtime to get an average of the runtime performance.

So, why am I running it on the old graalvm-0.25 version? Well, whatever is in a benchmark is gonna get optimized making the difference here less apparent.

We’ll run the new improved version later.

MJIT vs. graalvm-0.25

So on my machine the initial execution of the pent.rb benchmark (timing startup, warmup and runtime) on TruffleRuby 0.25 took 15.05 seconds while it just took 7.26 seconds with MJIT. Which has MJIT being 2.1 times faster. Impressive!

What’s when we account for startup and warmup though? If we benchmark just in ruby startup time already goes away, as we can only start measuring inside ruby once the interpreter has started. Now for warmup, we run the code to benchmark in a loop for 60 seconds of warmup time and 60 seconds for measuring the actual runtime. I plotted the execution times of the first 15 iterations below (that’s about when TruffleRuby stabilizes):

2_warmup.png
Execution time of TruffleRuby and MJIT progressing over time – iteration by iteration.

As you can clearly see, TruffleRuby starts out a lot slower but picks up speed quickly while MJIT stay more or less consistent. What’s interesting to see is that iteration 6 and 7 of TrufleRuby are slower again. Either it found a new optimization that took significant time to complete or a deoptimization had to happen as the constraints of a previous optimization were no longer valid. TruffleRuby stabilizes from there and reaches peak performance.

Running the benchmarks we get an average (warm) time for TruffleRuby of 1.75 seconds and for MJIT we get 7.33 seconds. Which means that with this way of measuring, TruffleRuby is suddenly 4.2 times faster than MJIT.

We went from 2.1 times slower to 4.2 times faster and we only changed the measuring method.

I like to present benchmarking numbers in iterations per second/minute (ips/ipm) as here “higher is better” so graphs are far more intuitive, our execution times converted are 34.25 iterations per minute for TruffleRuby and 8.18 iterations per minute for MJIT. So now have a look at our numbers converted to iterations per minute compared for the initial measuring method and our new measuring method:

2_comparison_before_after.png
Results of timing the whole script execution (initial time) versus the average execution time warmed up.

You can see the stark contrast for TruffleRuby caused by the hefty warmup/long execution time during the first couple of iterations. MJIT on the other hand, is very stable. The difference is well within the margin of error.

Ruby 2.0 vs MJIT vs. graalvm-0.25 vs. graalvm-0.27

Well, I promised you more data and here is more data! This data set also includes CRuby 2.0 as the base line as well as the new graalvm.

initial time (seconds) ipm of initial time average (seconds) ipm of average after warmup Standard Deviation as part of total
CRuby 2.0 12.3 4.87 12.34 4.86 0.43%
TruffleRuby 0.25 15.05 3.98 1.75 34.25 0.21%
TruffleRuby 0.27 8.81 6.81 1.22 49.36 0.44%
MJIT 7.26 8.26 7.33 8.18 2.39%

4_warmup.png
Execution times by iteration in second. CRuby stops appearing because that were already all the iterations I had.

We can see that TruffleRuby 0.27 is already faster than MJIT in the first iteration, which is quite impressive. It’s also lacking the weird “getting slower” around the 6th iteration and as such reaches peak performance much faster than TruffleRuby 0.25. It also gets faster overall as we can see if we compare the “warm” performance of all 4 competitors:

4_comparison.png
Iterations per Minute after warmup as an average of our 4 competitors.

So not only did the warmup get much faster in TruffleRuby 0.27 the overall performance also increased quite a bit. It is now more than 6 times faster than MJIT. Of course, some of it is probably the TruffleRuby team tuning it to the existing benchmark, which reiterates my point that we do need better benchmarks.

As a last fancy graph for you I have the comparison of measuring the runtime through time versus giving it warmup time, then benchmarking multiple iterations:

4_comparison_before_after.png
Difference between measuring whole script execution versus letting implementations warmup.

CRuby 2 is quite consistent as expected, TruffleRuby already manages a respectable out of the box performance but gets even faster. I hope this helps you see how the method of measuring can achieve drastically different results.

Conclusion

So, what can we take away? Startup time and warmup are a thing and you should think hard about whether those times are important for you and if you want to measure them. For web applications, most of the time startup and warmup aren’t that important as 99.99%+ you’ll run with a warm “runtime” performance.

Not only what time we measure is important, but also what code we measure. Benchmarks should be as realistic as possible so that they are as significant as possible. What a benchmark on the Internet check most likely isn’t directly related to what your application does.

ALWAYS RUN YOUR OWN BENCHMARKS AND QUESTION BOTH WHAT CODE IS BENCHMARKED, HOW IT IS BENCHMARKED AND WHAT TIMES ARE TAKEN

(I had this in my initial draft, but I ended up quite liking it so I kept it around)

edit1: Added CLI tool specifically to where startup & warmup counts as well as a reference to Substrate VM for how TruffleRuby tries to combat it 🙂

edit2: Just scroll down a little to read an interesting comment by Vladimir

Benchmarking a Go AI in Ruby: CRuby vs. Rubinius vs. JRuby vs. Truffle – a year later

A little more than a year ago I published a blog post benchmarking different ruby implementations against a bot that plays Go which I wrote. Now a little than a year later (~13.5 months) let’s see how the different contestants have improved in the time passed.

This question becomes increasingly interesting as Ruby 3.0 aims to be 3 times as fast as Ruby 2.0.

As last time the benchmarks will be run on my Go bot rubykon, which has barely changed since then. The important question for Monte Carlo Tree Search (MCTS) bots is how many simulations can I run, as this improves quality of play. You can check out the old blog post for more rationale on this.

Setup

The benchmarks were run on the 16th of January 2017 with the following concrete Ruby versions (versions slightly abbreviated in the rest of the post):

  • CRuby 2.0.0p648
  • CRuby 2.2.3p173
  • Rubinius 2.5.8
  • JRuby 9.0.3.0
  • JRuby 9.0.3.0 in server mode and with invoke dynamic enabled (denoted as + id)
  • Truffleruby with master from 2015-11-08 and commit hash fd2c179, running on graalvm-jdk1.8.0
  • CRuby 2.4.0p0
  • Rubinius 3.69
  • JRuby 9.1.7.0
  • JRuby 9.1.7.0 in server mode and with invoke dynamic enabled (denoted as + id)
  • Truffleruby on truffle-head from 2016-01-16 with commit hash 4ad402a54cf, running on graal-core master from 2016-01-16 with commit hash 8f1ad406d78f2f built with a JVMCI enabled jdk8 (check out the install script)

As you might notice I prefer to say CRuby over MRI and very old versions are gone – e.g. I dropped benchmarking CRuby 1.9.x and JRuby 1.7.x. I also added CRuby 2.0 – as it is the comparison standard for Ruby 3.0. The next 5 versions are the remaining rubies from the original benchmark, the other five are their most up to date versions.

All of this is run on my Desktop PC running Linux Mint 18 (based on Ubuntu 16.04 LTS) with 16 GB of memory and an i7-4790 (3.6 GHz, 4 GHz boost). Also running on openjdk 8.


tobi@speedy ~ $ uname -a
Linux speedy 4.4.0-59-generic #80-Ubuntu SMP Fri Jan 6 17:47:47 UTC 2017 x86_64 x86_64 x86_64 GNU/Linux
tobi@speedy ~ $ java -version
openjdk version "1.8.0_111"
OpenJDK Runtime Environment (build 1.8.0_111-8u111-b14-2ubuntu0.16.04.2-b14)
OpenJDK 64-Bit Server VM (build 25.111-b14, mixed mode)

Full Monte Carlo Tree Search with 1000 playouts

I cut out the first benchmark from last years edition due to some trouble of getting benchmark-ips running – so we’ll stick with the more macro benchmark that performs a full Monte Carlo Tree Search using UCT on a 19×19 board doing 1000 playouts and see how fast we can get here. This is really the whole package of what we need to make fast for the Go-Bot to be fast! Th benchmark uses benchmark-avg, which I wrote to support more macro benchmarks than bencmark-ips.

The benchmarking code is quite simple:

Benchmark.avg do |benchmark|
game_state_19 = Rubykon::GameState.new Rubykon::Game.new(19)
mcts = MCTS::MCTS.new

benchmark.config warmup: 180, time: 180

benchmark.report "19x19 1_000 iterations" do
mcts.start game_state_19, 1_000
end
end

As you can see we run plenty of warmup – 3 minutes of it – and then 3 minutes of benchmarking time. So let’s see how many iterations per minute our contestants manage here:

Iterations per minute - higher is better
Iterations per minute – higher is better

As one can see, truffleruby is leading the pack by quite a margin,  followed by JRuby (but still over 2 times faster than it). Truffleruby is also an impressive 7 times faster than CRuby 2.4.0.

Of course, as the new benchmark was inspired by Ruby 3.0 aiming to be 3 times as fast as Ruby 2.0 – how are we doing? Do we maybe already have a 3 times faster Ruby? Well, there is a graph for that!

rubykon_2_speedup

As we can see JRuby 9.1.7.0 run in server mode and with invoke dynamic enabled is the first one to be 3 times faster than CRuby 2.0. Also, both the old version of truffleruby and the newest are 3 times faster than our baseline – the new one even 9 times faster! CRuby 2.4 on the other hand is at about a 14% improvement as compared to 2.0.

Another metric that intrigues me is how did the implementation improve in the time in between benchmarks, to gauge where the journey is going. Therefore, the next chart compares the newest version of a Ruby implementation benchmarked here against their older sibling from last time (Ruby 2.4.0 against 2.2.3, JRuby 9.1.7.0 vs. 9.0.3.0 etc.):

Speedup against older version (higher is better)

CRuby improved by about 11%, JRuby with invokedynamic about 18% while truffleruby, already leading the pack last time, managed another 2x performance improvement!

The odd one out clearly is Rubinius that only manages bout 20% of the performance of its former version (or a 5x decrease, if you will). This seemed like a setup error on my part at first, but it is not as Rubinius removed their JIT. As this benchmark is a prime example of a pretty hot loop running, the hit of removing the JIT naturally is pretty hard.

The slight decrease in JRuby performance without invokedynamic is slightly weird but it’s so small that it might as well be measurement inaccuracies.

Of course, for the data fans here is the raw table:

Ruby ipm average time (s) standard deviation Speedup to 2.0
2.0.0p648 4.54 13.22 0.44% 1
2.2.3p173 4.68 12.83 1.87% 1.0308370044
rbx-2.5.8 4.67 12.84 1.91% 1.0286343612
JRuby 9.0.3.0 7.75 7.74 0.47% 1.7070484581
JRuby 9.0.3.0 + id 12.81 4.68 0.80% 2.8215859031
truffleruby old 16.93 3.54 10.70% 3.7290748899
2.4.0p0 5.2 11.53 2.18% 1.1453744493
rbx-3.69 1.01 59.4 0.30% 0.2224669604
JRuby 9.1.7.0 7.34 8.17 2.12% 1.6167400881
JRuby 9.1.7.0 + id 15.12 3.97 0.62% 3.3303964758
truffleruby 36.65 1.64 1.25% 8.0726872247

Thoughts on different Ruby implementations

Let’s wrap this up with a couple of thoughts on the different implementations:

TruffleRuby

TruffleRuby is making steady and great progress, which I’m thoroughly impressed with. To be honest, I was wondering if its performance increased since the last benchmark as I was worried that implementing new Ruby features would lead to decreased performance. Seeing that it still managed a 2x performance improvement is mind boggling.

Raw speed is one thing, but if you’re familiar with TruffleRuby, one of the more noticable downsides is the big warmup time that it needs to do all of its fancy optimizations – so the peak performance you see here is only achieved after a certain time where it is much slower. Still, I’m happy to say that warmup also improved since last time! Where the old truffleruby, in my benchmarks, took about 101 seconds or 13 iterations to reach peak performance (hence the very long warmup time, to make sure every implementation is warm) the new one took around 52 seconds or 7 iterations. Still – the first of those warmup iterations took 27 seconds, so if you can’t deal with some warmup time to start with this might be a deal breaker.

Warmup is an important topic here – rubykon has no external dependencies so there’s not much code that needs to be JITed and also TruffleRuby can probably do its type optimizations of specific methods rather efficiently.

Of course, the team is working on that – there is a really noteworthy post about the state of TruffleRuby in early 2017. There further plans are detailed, e.g. C-extension support, improving startup time (drastically!) and running Rails.

It shall also be mentioned here, that setting up TruffleRuby took by far the most time and some bugs had crept in that needed fixing for Rubykon to run again. But after all this is a pre 1.0 project so these problems are to be expected. And with that in mind I want to explicitly thank Chris Seaton and Benoit Daloze for helping me with my setup troubles, fixing bugs and being woefully nice and responsive in general. Benoit even wrote a script to install the current graal-core master to run TruffleRuby with, which I was struggling with and which is needed at the moment to run rubykon on TruffleRuby without optfails.

JRuby

JRuby is coming along nicely, it’s the only Ruby implementation that runs this benchmark at a 3x speed of Ruby 2.0 while able to run whole Rails applications at the same time. It’s still my little personal favorite that I’d love to see more adoption of in the general ruby scene. Any time I see a talk or blog post about “Moving from ruby to the JVM for performance/Java interop” that doesn’t mention JRuby but goes straight to Java/Clojure/Scala & friends it makes me sad (nothing against those technologies though, they’re great!).

JRuby at the moment also sits sort of in the middle of CRuby and TruffleRuby in other concerns – it takes more warmup time than CRuby but a lot less than TRuffleRuby while still reaching nice peak performance. The latest release also brought along some nice performance improvements and we can only expect more of those in the future.

CRuby/MRI

CRuby is coming along nicely and steadily – we get nice improvements to the language and a 14% performance improvement over 2.0 isn’t negligible as well. It’s still a long shot from the targeted 3x. To be fair though, the team is still in the process of defining the benchmarks for which “Ruby 3×3” will be measured (current plan afaik is to have 9 of those cause 3×3 = 9). This is the ground work to start optimization work, and Ruby 3 is still far in the future with the estimated release in 2020.

Rubinius

Sadly, this is my bummer of this benchmarking round. A 5x performance decrase as compared to the previous version of this benchmark was quite surprising, as noted before this is due to the removed JIT. Comment courtesy of Brian (maintainer of Rubinus) from the issue I opened:

@PragTob the just-in-time compiler (JIT) has been removed to make way for a new interpreter and JIT infrastructure. That is the reason you’re seeing the performance degradation (and illustrates how important JIT is to making Ruby fast). The JIT was removed because it had a number of bugs and was too complicated, resulting in almost no contributors making improvements.

If I do a next version of these benchmarks and Rubinius by then doesn’t have a JIT again or some other performance improvements, then I’ll probably drop benchmarking it. It’s far behind the others as of now and if Rubinius’s goal isn’t speed but developer experience or whatever then there also isn’t much sense in benchmarking it 🙂

Final Thoughts

CRuby and JRuby did mostly what I expect them to – improve at a steady and good pace. TruffleRuby truly surprised me with 2x improvements in run time and warmup. Still a bit skeptic about warmup time when it’s running a full fledged Rails application but happy to try that out once they get there 🙂 It makes me wonder though, if I ported Rubykon to Crystal how would the performance compare to Truffle? Ah, time…

Almost forgot the usual disclaimer so here it goes: Always run your own benchmarks! This is a very CPU intensive AI problem typically solved by much more performant languages. I did it for fun and to see how far I could get. Also this benchmark most certainly isn’t indicative for performance of running a Rails application – the parts heavily used by Rails are most likely way different than what this does. E.g. we have no I/O here and little to no String operations, which play a bigger role in Rails. It might point in the right direction and speed improvements might be the same, but they don’t have to be.

Finally, this took me WAY longer than I expected to. I started this over a month ago while I still had time off. Compilation/running problems with old and very shine new rubies mostly to blame. So not sure if I’ll do this again in a year’s time – so if you’d like to see this and like this sort of thing please let me know 🙂


Benchmarking a Go AI in Ruby: CRuby vs. Rubinius vs. JRuby vs. Truffle/Graal

The world of Artificial Intelligences is often full of performance questions. How fast can I compute a value? How far can I look ahead in a tree? How many nodes can I traverse?

In Monte Carlo Tree Search one of the most defining questions is “How many simulations can I run per second?”. If you want to learn more about Monte Carlo Tree Search and its application to the board game Go I recommend you the video and slides of my talk about that topic from Rubyconf 2015.

Implementing my own AI – rubykon – in ruby of course isn’t going to get me the fastest implementation ever. It forces you to really do less and therefore make nice performance optimization, though. This isn’t about that either. Here I want to take a look at another question: “How fast can Ruby go?” Ruby is a language with surprisingly many well maintained implementations. Most prominently CRuby, Rubinius, JRuby and the newcomer JRuby + Truffle. How do they perform in this task?

The project

Rubykon is a relatively small project – right now the lib directory has less than 1200 lines of code (which includes a small benchmarking library… more on that later). It has no external runtime dependencies – not even the standard library. So it is very minimalistic and also tuned for performance.

Setup

The benchmarks were run pre the 0.3.0 rubykon version on the 8th of November (sorry writeups always take longer than you think!) with the following concrete ruby versions (versions slightly abbreviated in the rest of the post):

  • CRuby 1.9.3p551
  • CRuby 2.2.3p173
  • Rubinius 2.5.8
  • JRuby 1.7.22
  • JRuby 9.0.3.0
  • JRuby 9.0.3.0 run in server mode and with invoke dynamic enabled (denoted as + id)
  • JRuby + Truffle Graal with master from 2015-11-08 and commit hash fd2c179, running on graalvm-jdk1.8.0

You can find the raw data (performance numbers, concrete version outputs, benchmark results for different board sizes and historic benchmark results) in this file.

This was run on my pretty dated desktop PC (i7 870):


tobi@tobi-desktop ~ $ uname -a
Linux tobi-desktop 3.16.0-38-generic #52~14.04.1-Ubuntu SMP Fri May 8 09:43:57 UTC 2015 x86_64 x86_64 x86_64 GNU/Linux
tobi@tobi-desktop ~ $ java -version
openjdk version "1.8.0_45-internal"
OpenJDK Runtime Environment (build 1.8.0_45-internal-b14)
OpenJDK 64-Bit Server VM (build 25.45-b02, mixed mode)
tobi@tobi-desktop ~ $ lscpu
Architecture:          x86_64
CPU op-mode(s):        32-bit, 64-bit
Byte Order:            Little Endian
CPU(s):                8
On-line CPU(s) list:   0-7
Thread(s) per core:    2
Core(s) per socket:    4
Socket(s):             1
NUMA node(s):          1
Vendor ID:             GenuineIntel
CPU family:            6
Model:                 30
Stepping:              5
CPU MHz:               1200.000
BogoMIPS:              5887.87
Virtualization:        VT-x
L1d cache:             32K
L1i cache:             32K
L2 cache:              256K
L3 cache:              8192K
NUMA node0 CPU(s):     0-7

First benchmark: Simulation + Scoring on 19×19

This benchmark uses benchmark-ips to see how many playouts (simulation + scoring) can be done per second. This is basically the “evaluation function” of the Monte Carlo Method. Here we start with an empty board and then play random valid moves until there are no valid moves anymore and then we score the game. The performance of a MCTS AI is hugely dependent on how fast that can happen.

Benchmarks were run with a warmup time of 60 seconds and a run time of 30 seconds. The small black bars in the graph denote standard deviation. Results:

19_19_ips.png
Full 19×19 playout, iterations per second (higher is better)

Ruby Version iterations per second standard deviation
CRuby 1.9.3p551 44.952 8.90%
CRuby 2.2.3p173 55.403 7.20%
Rubinius 2.5.8 40.911 4.90%
JRuby 1.7.22 63.456 15.80%
JRuby 9.0.3.0 73.479 6.80%
JRuby 9.0.3.0 + invoke dynamic 121.265 14.00%
JRuby + Truffle 192.42 14.00%

JRuby + Truffle runs on a slightly modified version of benchmark-ips. This is done because it is a highly optimizing and speculative runtime that leads to bad results after warmup. This is explained here.

Second benchmark: Full UCT Monte Carlo Tree Search with 1000 playouts

This benchmark does a full Monte Carlo Tree Search, meaning choosing a node to investigate, doing a full simulation and scoring there and then propagating the results back in the tree before starting over again. As the performance is mostly dependent on the playouts the graph looks a lot like the one above.

This uses benchmark-avg, which I wrote myself and (for now) still lives in the rubykon repository. Why a new benchmarking library? In short: I needed something for more “macro” benchmarks that gives nice output like benchmark-ips. Also, I wanted a benchmarking tool that plays nice with Truffle – which means doing warmup and run of a benchmark directly after one another, as detailed in this issue.

This uses a warmup time of 3 minutes and a run time of 2 minutes. Along with the iterations per minute, we have another graph depicting average run time.

19_19_ipm.png
MCTS on 19×19 with 1000 playouts, iterations per minute (higher is better)

19_19_avg.png
MCTS on 19×19 with 1000 playouts, average run time (lower is better)

Ruby Version iterations per minute average time (s) standard deviation
CRuby 1.9.3p551 1.61 37.26 2.23%
CRuby 2.2.3p173 2.72 22.09 1.05%
Rubinius 2.5.8 2.1 28.52 2.59%
JRuby 1.7.22 3.94 15.23 1.61%
JRuby 9.0.3.0 3.7 16.23 2.48%
JRuby 9.0.3.0 + invoke dynamic 7.02 8.55 1.92%
JRuby + Truffle 9.49 6.32 8.33%

Results here pretty much mirror the previous benchmark, although standard deviation is smaller throughout which might be because more non random code execution is involved.

Otherwise the relative performance of the different implementations is more or less the same, with the notable exception of JRuby 1.7 performing better than 9.0 (without invoke dynamic). That could be an oddity, but it is also well within the margin of error for the first benchmark.

For the discussion below I’ll refer to this benchmark, as it ran on the same code for all implementations and has a lower standard deviation overall.

Observations

The most striking observation certainly is JRuby + Truffle/Graal sits atop in the benchmarks with a good margin. It’s not that surprising when you look at previous work done here suggesting speedups of 9x to 45x as compared to CRuby. Here the speedup relative to CRuby is “just” 3.5 which teaches us to always run your own benchmarks.

It is also worth noting that Truffle first was unexpectedly very slow (10 times slower than 1.9) so I opened an issue and reported that somewhat surprising lack in performance. Then Chris Season was quick to fix it and along the way he kept an amazing log of things he did to diagnose and make it faster. If you ever wanted to take a peek into the mind of a Ruby implementer – go ahead and read it!

At the same time I gotta say that the warmup time it takes has got me worried a bit. This is a very small application with one very hot loop (generating the valid moves). It doesn’t even use the standard library. The warmup times are rather huge exactly for Truffle and I made sure to call no other code in benchmark/avg as this might deoptimize everything again. However, it is still in an early stage and I know they are working on it 🙂

Second, “normal” JRuby is faster than CRuby which is not much of a surprise to me – in most benchmarks I do JRuby comes up ~twice as fast CRuby. So when it was only ~30% faster I was actually a bit disappointed, but then remembered the --server -Xcompile.invokedynamic=true switches and enabled them. BOOM! Almost 2.6 times faster than CRuby! Almost 90% faster than JRuby without those switches.

Now you might ask: “Why isn’t this the default?” Well, it was the default. Optimizing takes time and that slows down the startup time, for say rails, significantly which is why it was deactivated by default.

If I’m missing any of these magic switches for any of the other implementations please let me know and I’ll add them.

I’m also a bit sad to see rubinius somewhere between 1.9 and 2.2 performance wise, I had higher hopes for its performance with some appropriate warmup time.

Also opal is notably missing, I couldn’t get it to run but will try again in a next version to see what V8 can optimize here.

An important word of warning to conclude the high level look at the different implementations: These benchmarks are most likely not true for your application! Especially not for rails! Benchmark yourself 🙂

Now for another question that you probably have on your mind: “How fast is this compared to other languages/implementations?” See, that’s hard to answer. No serious Go engine does pure random playouts, they all use some heuristics slowing them down significantly. But, they are still faster. Here’s some data from this computer go thread, they all refer to the 19×19 board size:

  • it is suggested than one should be able to do at least 100 000 playouts per second without heuristics
  • With light playouts Aya did 25 000 playouts in 2008
  • well known C engine pachi does 2000 heavy playouts per thread per second

Which leads us to the question…

Is this the end of the line for Ruby?

No, there are still a couple of improvements that I have in mind that can make it much faster. How much faster? I don’t know. I have this goal of 1000 playouts on 19×19 per second per thread in mind. It’s still way behind other languages, but hey we’re talking about Ruby here 😉

Some possible improvements:

  • Move generation can still be improved a lot, instead of always looking for a new valid random moves a list of valid moves could be kept around, but it’s tricky
  • Scoring can also be done faster by leveraging neighbouring cells, but it’s not the bottleneck (yet)
  • a very clever but less accurate data structure can be used for liberty counting
  • also, of course, actually parallelize it and run on multiple threads
  • I could also use an up to date CPU for a change 😉

Other than that, I’m also looking over to the ruby implementations to get better, optimize more and make it even faster. I have especially high hopes for JRuby and JRuby + Truffle here.

So in the future I’ll try to find out how fast this can actually get, which is a fun ride and has taught me a lot so far already! You should try playing the benchmark game for yourselves 🙂