If you look around this blog it becomes pretty clear that I really love (micro) benchmarking. Naturally, while working more and more with Elixir (and loving it!) I wanted to benchmark something. Sadly, the existing options I found didn’t quite satisfy me. Be it for a different focus, missing statistics, lacking documentation or other things. So I decided to roll my own, it’s not like it’d be the first time.
Of course I tried extending existing solutions but very long functions, very scarce test coverage, lots of dead and outcommented code and a rotting PR later I decided it was time to create something new. So without further ado, please meet Benchee (of course available on hex)!
What’s great about Benchee?
Benchee is easy to use, well documented and can be extended (more on that in the following paragraphs). Benchee will run each benchmarking function you give it for a given amount of time and then compute statistics from it. Statistics is where it shines in my opinion. Benchee provides you with:
- average run time (ok – yawn)
- iterations per second, which is great for graphs etc. as higher is better here (as opposed to average run time)
- standard deviation, an important value in my opinion as it gives you a feeling for how certain you can be about your measurements and how much they vary. Sadly, none of the elixir benchmarking tools I looked at supplied this value.
- median, it’s basically the middle value of your distribution and is often cited as a value that reflects the “common” outcome better than average as it cuts out outliers. I never used a (micro) benchmarking tool that provided this value, but was often asked to provide it in my benchmarks. So here it is!
Also it gives a rather nice output on the console with headers so you know what is what. An example is further down but for now let’s talk design…
Designing a Benchmarking library
The design is influenced by my favourite ruby benchmarking library: benchmark-ips. Of course I wanted it to be more of an elixirish spin and offer more options.
A lot of elixir solutions used macros. I wanted something that works purely with functions, no tricks. When I started to learn more about functional programming one of the things that stuck with me the most was that functional programming is about a series of transformations. So what do these transformations look like for benchmarking?
- Create a basic benchmarking configuration with things like how long should the benchmark run, should GC be enabled etc.
- Run individual benchmarks and record their raw execution times
- Compute statistics based on these raw run times per benchmark
- Format the statistics to be suitable for output
- Put out the formatted statistics to the console, a file or whatever
So what do you now, that’s exactly what the API of Benchee looks like!
list = Enum.to_list(1..10_000)
map_fun = fn(i) -> [i, i * i] end

Benchee.init(%{time: 3})
|> Benchee.benchmark("flat_map", fn -> Enum.flat_map(list, map_fun) end)
|> Benchee.benchmark("map.flatten",
                     fn -> list |> Enum.map(map_fun) |> List.flatten end)
|> Benchee.statistics
|> Benchee.Formatters.Console.format
|> IO.puts
What’s great about this? Well it’s super flexible and flows nicely with the beloved elixir pipe operator.
Why is this flexible and extensible? Well, don’t like how Benchee runs the benchmarks? Sub in your own benchmarking function! Want more/different statistics? Go use your own function and compute your own! Want results to be displayed in a different format? Roll you own formatter! Or you just want to write the results to a file? Well, go ahead!
This is more than just cosmetics. It’d be easy to write a plugin that converts the results to some JSON format and then post them to a web service to gather benchmarking results or let it generate fancy graphs for you.
Of course, not everybody needs that flexibility. Some people might be scared away by the verboseness above. So there’s also a higher level interface that uses all the options you see above and condenses them down to one function call to efficiently define your benchmarks:
list = Enum.to_list(1..10_000)
map_fun = fn(i) -> [i, i * i] end

Benchee.run(%{time: 3},
             [{"flat_map", fn -> Enum.flat_map(list, map_fun) end},
              {"map.flatten",
              fn -> list |> Enum.map(map_fun) |> List.flatten end}])
Let’s see some results!
You’ve seen two different ways to run the same benchmark with Benchee now, so what’s the result and what does it look like? Well here you go:
tobi@happy ~/github/benchee $ mix run samples/run.exs
Benchmarking flat_map...
Benchmarking map.flatten...

Name                          ips            average        deviation      median
map.flatten                   1311.84        762.29μs       (±13.77%)      747.0μs
flat_map                      896.17         1115.86μs      (±9.54%)       1136.0μs

Comparison:
map.flatten                   1311.84
flat_map                      896.17          - 1.46x slower
So what do you know, much to my own surprise calling map first and then flattening the result is significantly faster than a one pass flat_map. Which is unlike ruby, where flat_map is over two times fast in the same scenario. So what does that tell us? Well, what we think about performance from other programming languages might not hold true. Also, that there might be a bug in flat_map – it should be faster for all that I know. Need some time to investigate 🙂
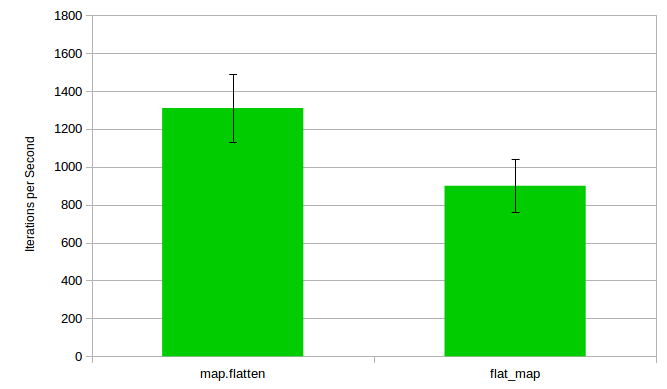
All that aside, wouldn’t a graph be nice? That’s a feature I envy benchfella for. But wait, we got this whole extensible architecture right? Generating the whole graph myself with error margins etc. might be a bit tough, though. But I got LibreOffice on my machine. A way to quickly feed my results into it would be great.
Meet BencheeCSV (the first and so far only Benchee plugin)! With it we can substitute the formatting and output steps to generate a CSV file to be consumed by a spreadsheet tool of our choice:
file = File.open!("test.csv", [:write])
list = Enum.to_list(1..10_000)
map_fun = fn(i) -> [i, i * i] end

Benchee.init
|> Benchee.benchmark("flat_map", fn -> Enum.flat_map(list, map_fun) end)
|> Benchee.benchmark("map.flatten",
                     fn -> list |> Enum.map(map_fun) |> List.flatten end)
|> Benchee.statistics
|> Benchee.Formatters.CSV.format
|> Enum.each(fn(row) -> IO.write(file, row) end)
And a couple of clicks later there is a graph including error margins:
How do I get it?
Well, just add benchee or benchee_csv to the deps of your mix.exs!
def deps do
  [{:benchee, "~> 0.1.0", only: :dev}]
end
Then run mix deps.get, create a benchmarking folder and create your new my_benchmark.exs! More information can be found in the online documentation or at the github repository.
Anything else?
Well Benchee tries to help you, that’s why when you try to micro benchmark an extremely fast function you might happen upon this beauty of a warning:
Warning: The function you are trying to benchmark is super fast, making time measures unreliable!
Benchee won’t measure individual runs but rather run it a couple of times and report the average back. Measures will still be correct, but the overhead of running it n times goes into the measurement. Also statistical results aren’t as good, as they are based on averages now. If possible, increase the input size so that an individual run takes more than 10μs
The reason why I put it there is pretty well explained. The measurements would simply be unreliable as randomness and the measuring itself have too huge of an impact. Plus, measurements are in micro seconds – so it’s not that accurate either. I tried nano seconds but quickly discarded them as that seemed to add even more overhead.
Benchee tries to run your benchmark n times then and measure that, while it improves the situation somewhat it adds the overhead of my repeat_n function to the benchmark.
So if you can, please benchmark with higher values 🙂
Ideas for the future?
Benchee is just version 0.1.0, but a lot of work, features and thought has already gone into it. Here are features that I thought about but decided they are not necessary for a first release:
- Turning off/reducing garbage collection: Especially micro benchmarking can be affected by garbage collection as single runs will be much slower than the others leading to a sky rocketing standard deviation and unreliable measures. Sadly, to the best of my knowledge, one can’t turn off GC on the BEAM. But people have shown me options where I could just set a very high memory space to reduce the chance of GC. Need to play with it.
- Auto scaling units: It’d be nice to for instance show the average time in milliseconds if a benchmark is slower or write something to the effect of “80.9 Million” iterations per second for the console output for a fast benchmark.
- Better alignment for console output. Right now it’s left aligned, I think right alignment looks better and helps compare results.
- Making sure Benchee is also usable for more macro benchmarks, e.g. functions that run in the matter of seconds or even minutes
- Correlating to that, also provide the option to specify a warmup time. Elixir/Erlang isn’t JITed so it should have no impact there, but for macro benchmarks on phoenix or so with the database it should have an impact.
- Give measuring memory consumption a shot
- More statistics: Anything you are missing, wishing for?
- Graph generation: A plugin to generate and share a graph right away would be nice
- Configurable steps in Benchee.run: Right now if you want to use a plugin you have to use the more “verbose” API of Benchee. If Benchee gains traction and plugins really become a thing it’d be nice to configure them in the high level API like
%{formatter: MyFormatModule} or %{formatter: MyFormatModule.format/1}.
So that’s it – have anything you’d like to see in Benchee? Please get in touch and let me know! In any case, give Benchee a try and happy benchmarking!

