This is just a quick remark that I’m on a podcast again! It’s programmier.bar and I’m talking with the hosts about Ruby & Rails!
You can listen to the episode on various platforms. It’s meant to be a good listen for beginners and tech interested people as well. It’s in German though, so sorry to the English speakers.
Last week I found myself at my old RailsGirls/code curious project group the rubycorns coaching a beginner through the FizzBuzz coding challenge. It was a lot of fun and I found myself itching to implement it again myself as I came up with some ideas about a nice solution given a requirement for arbitrary or changing rules to the game.
I’ve also been working on blog posts helping people interview processes, the next of which will be about Technical Challenges/Code challenges (due to be published tomorrow! edit: Published now!). This is a little extension for that blog post, as an example of going through and improving a coding challenge.
To be clear, I don’t endorse FizzBuzz as a coding challenge. In my opinion something closer to your domain is much more valuable. However, it is (probably) the most well known coding challenge so I wanted to examine it a bit. It is also deceptively simple, and so deserves some consideration.
So, in this blog post let’s start with what FizzBuzz is and then let’s iteratively go through writing and improving it. Towards the end we’ll also talk about possible extensions of the task and how to deal with them. The examples here will be in Ruby, but are easy to transfer to any other programming language. If you’re only here for the code, you can check out the repo.
The FizzBuzz Challenge
The challenge, inspired by a children’s game, originated from the blog post “Using FizzBuzz to Find Developers who Grok Coding” by Imran Ghory back in 2007 – the intent being to come up with a question as simple as possible to check if people can write code.
The problem goes as follows:
Write a program that prints the numbers from 1 to 100. But for multiples of three print “Fizz” instead of the number and for the multiples of five print “Buzz”. For numbers which are multiples of both three and five print “FizzBuzz”.
Simple enough, right? Well, I think it actually checks for some interesting properties and is a good basis for a conversation. To get started, let’s check out a basic solution.
Basic Solution
This file contains bidirectional Unicode text that may be interpreted or compiled differently than what appears below. To review, open the file in an editor that reveals hidden Unicode characters.
Learn more about bidirectional Unicode characters
That one does the job perfectly fine. It prints out the numbers as requested. It also helps to illustrate some of the difficulties with the challenge:
First off, printing out the results is interesting as it is notoriously hard to test (while possible given the correct helpers). It should push a good programmer towards separating the output concern from the business logic concern. So, a good solution should usually feature a separate function fizz_buzz(number) that given any number number either returns the number itself or ”FizzBuzz” etc. according to the rules. This is wonderfully easy to test, but many struggle initially to make that separation of concerns. We’ll get to that in a second.
What I don’t like about the challenge is that it requires knowledge about the modulo operator, as it isn’t commonly used, but you need it to check whether a number is actually divisible. Anyhow, there will be a lot of code like: number % 3 == 0. To avoid repetition and instead speak in the language of the domain it’s much better to extract this functionality into a function divisible_by?(number, divisor). Makes the code read nicer and removes inherent duplication.
Speaking of the division, the order in which you check the conditions (namely, being divisible by 3 and 5, or 15, before the individual checks) is crucial for the program to work and I’ve seen more than one senior engineer stumble upon this.
With that in mind, let’s improve the challenge!
We need to go back
First off, while the previous solution is “perfectly” fine, I’d probably never write it as it’s hard to test – it’s just a script to run and everything is printed to the console. And since I’m a TDD kind of person, that won’t do! I usually start, as teased before, by just implementing a function fizz_buzz(number) – that’s the core of the business logic. The iteration and printing out are just secondary aspects to me, so let’s start there:
This file contains bidirectional Unicode text that may be interpreted or compiled differently than what appears below. To review, open the file in an editor that reveals hidden Unicode characters.
Learn more about bidirectional Unicode characters
This file contains bidirectional Unicode text that may be interpreted or compiled differently than what appears below. To review, open the file in an editor that reveals hidden Unicode characters.
Learn more about bidirectional Unicode characters
Much better, and it’s tested! You may think that the test generation from the hash is overdone, but I love how easy it is to adjust and modify test cases. No ceremony, I just add an input and an expected output. Also, yes – tests. When solving a coding challenge tests should usually be a part of it unless you’re explicitly told not to. Testing is an integral skill after all.
Ok, let’s make it a full solution.
Full FizzBuzz
Honestly, all that is required to turn it into a full FizzBuzz solution is a simple loop and output. What is a bit fancier is the integration test I added to go along with it:
This file contains bidirectional Unicode text that may be interpreted or compiled differently than what appears below. To review, open the file in an editor that reveals hidden Unicode characters.
Learn more about bidirectional Unicode characters
This file contains bidirectional Unicode text that may be interpreted or compiled differently than what appears below. To review, open the file in an editor that reveals hidden Unicode characters.
Learn more about bidirectional Unicode characters
Simple isn’t it? You may argue that the integration test is too much, but when I can write an integration test as easy as this I prefer to do it. When I write code that generates files, like PAIN XML, I also love to have a full test that makes sure when given the same inputs we get the same outputs. This has the helpful side effect that even minor changes become very apparent in the pull request diff.
Anyhow, the other thing that we see is that our separation of concerns with the fizz_buzz(number) function pushed us to here is that there is only a single puts statement. We separated the output concern from the business logic. Should we want to change the output – perhaps it should be uploaded to an SFTP sever – then there is a single point for us to adjust that in. Of course we could also use dependency injection to make the method of delivery easier to change, but without a hint that we might need it this is likely overdone. Especially since I’d still want to keep the full integration test we just wrote, programs have a tendency to break in the most unanticipated ways.
Keeping up with the Domain
The other thing I complained about initially was the usage of the modulo operator. Truth be told, I only wrote the initial version like this for demonstration purposes – that one has to go. I don’t want to think about what “modulo a number equals 0” means. Whether or not something is divisible is something I understand and can work with. It also removes a fair bit of duplication:
This file contains bidirectional Unicode text that may be interpreted or compiled differently than what appears below. To review, open the file in an editor that reveals hidden Unicode characters.
Learn more about bidirectional Unicode characters
Much better! There is a small optimization here, where we only check the divisibility twice instead of 4 times. It doesn’t fully matter, but when I see the exact same code being run twice in a method and I can remove it without impacting readability I love to do it.
I consider this a good solution. However, now is where the fun of many coding challenges starts – what extension points are there?
Extension Points
Many coding challenges have potential extension points baked in. Some extra features, or, what I almost prefer dealing with, uncertainty and how that might affect software design.
How certain are we that we need the first 100 numbers? How certain are we that we want to print it out on the console? Is there a possibility that we’ll get a 3rd number like 7 and how would that work? How certain are we that it’s the numbers 3, 5 and the words Fizz and Buzz?
Depending on the answers to these question you could go, adjust the challenge to make these easier to change. And with answers I don’t mean you making them up, but in case of a live coding challenge you talking to your interviewers to see what they think. A common case for instance would be that the numbers and strings may change while we’re certain it will be 2 numbers and 2 distinct strings – “product is still trying to figure out the exact numbers and text and they might change in the future as we’re experimenting in the space”.
Let’s run with that for now – we think it will always be 2 numbers but we’re not sure what 2 numbers and we’re also not sure about Fizz and Buzz. What do we do now?
Going Constants
One of the easiest solutions to this is to extract the relevant values to constants or even into a config.
This file contains bidirectional Unicode text that may be interpreted or compiled differently than what appears below. To review, open the file in an editor that reveals hidden Unicode characters.
Learn more about bidirectional Unicode characters
Right, so that got a lot longer and frankly also a bit more confusing. However, it is now immediately apparent where to change the values. That said, we also kept the “FizzBuzz” naming for the constants which may get extra confusing if we changed the text to something like “Zazz”. It’s always a tradeoff, the previous version was definitely more readable. We did get rid of “Magic numbers” and “Magic Strings”. Sadly, due to the nature of the challenge, they are also still very magical as there is no inherent reasoning to them 😅
Something bugs me with this solution though, and that’s the reason why I actually went and implemented it myself again (and wrote this post): There is an obvious relation between FIZZ_NUMBER and FIZZ_TEXTbut from a code point of view they are completely separate data structures only held together by naming conventions and their usage together.
Working With Rules
Ideally we’d want a data structure to hold both the text to be outputted and the number that triggers it together. There’s a gazillion ways you could go about this. You could simply use maps, arrays or tuples to hold that data together. As we’re doing Ruby right now, I decided to create an object that holds the rule and can apply itself to a rule – either returning its configured text or nil.
This file contains bidirectional Unicode text that may be interpreted or compiled differently than what appears below. To review, open the file in an editor that reveals hidden Unicode characters.
Learn more about bidirectional Unicode characters
Now, that’s quite different! Does it work? Well, yes – and the beauty of it is that so far we haven’t altered our API at all so all of these were internal refactorings that work with exactly the same set of tests. Yes, technically this adds additional optional parameters, we’ll get to these later 😉
The most interesting thing about this is that the rule of “if it is divisible by both do X” is gone. Turns out, that rule isn’t really needed:
if it is divisible by 3 add “Fizz” to the output
if it is divisible by 5 add “Buzz” to the output
if it is divisible by neither, just print out the number itself
That works just as well. It means that the order in which we store rules in our DEFAULT_RULES array matters (so we don’t end up with “BuzzFizz”). Of course we need to verify this with our stakeholders/interviewers, but let’s say they agree here. Now, can we allow for even more flexibility with the rules?
Flexible Rules
Now our “stakeholders” might come back and say well, you know what we’re not so sure about just having 2 numbers and their respective outputs. It may be more, it may be less! The good news? This already completely works with our implementation above. However, we should still test it. You can take a look at all the test I wrote over here, I’ll just post the tests here for adding a 3rd rule: 7 and Zazz!
This file contains bidirectional Unicode text that may be interpreted or compiled differently than what appears below. To review, open the file in an editor that reveals hidden Unicode characters.
Learn more about bidirectional Unicode characters
As per usual, testing all the different edge cases here is a fun exercise:
What is the behavior if no rules are passed?
What happens if the exact same rule is applied twice?
Can I change the order to make it “BuzzFizz”?
What I also like about this solution is that the rules aren’t actually hard coded but are injected from the outside. That allows us to easily test our system against many different rule configurations. It also allows us to run many different rule configurations in the same system – each user of our FizzBuzz platform could have their own settings for FizzBuzz!
Closing Out
That’s quite a bit of changes we went through here. I want to stress, that you shouldn’t start with the more complex solution as it is definitely harder to understand. You Ain’t Gonna Need It.However, if there are actual additional requirements or credible uncertainty it might be worth it. I ended up implementing it because I wanted to translate that relationship between “3” and “Fizz” explicitly into a data structure, as it feels like an inherent part of the domain. The other properties of it were almost just a by-product.
You can check out the whole code on github and let me know what you think.
Of course, we haven’t handled all extension points here:
The range of 1 to 100 is still hard coded, however that is easily remedied if necessary (by passing the range in as a parameter)
Our choice of the implementation of Rule hard coded the assumption that rules only ever check the divisibility by a number. We couldn’t easily produce a rule that says “for every odd number output ‘Odd'”. Instead of providing Rule with just a number, we could instead use an anonymous function to make it even more configurable. However, don’t ever forget you ain’t gonna need it – even in a coding challenge. Overengineering is also often bad, hence the conversation with your stakeholders/interviewers is important as for what are “sensible” extension points.
The output mechanism is still just puts, as mentioned earlier dependency injecting an object with a specific output method instead would make that more configurable and quite easily so.
Naturally, naming is important and could see some improvement here. However, with completely made up challenges having good naming becomes nigh impossible.
Anyhow, I hope you enjoyed this little journey through FizzBuzz and that it may have been helpful to you. I certainly enjoyed writing that solution 😁
Edit: Earlier versions of the code samples featured bitwise-and (&) instead of the proper and operator (&&) – both work in this context (hence the tests passed) but you should definitely be using &&. Thanks to my friend Jesse Herrick for pointing that out. Yes the featured image is still wrong. I won’t fix it.
Back last year in June of 2022 I gave what’s one of my favorite talks (of myself) at the wonderful conference Code Beam A Coruña. It’s a talk where I take some of my interests – Basketball, fiction writing, game development and trading card games – and look what we can learn about software development from them.
The talk was a major hit at the conference, with way more people than normal coming up to me to thank me about it and to talk about it. The video has been online for 10 months, but I just saw it yesterday and I must admit to watching the full talk. I had forgotten quite some aspects of the talk, so it was educational – even for me. Normally, I never watch my talks back – this seemed worth it.
The audio quality isn’t the best, but I hope you might still enjoy it!
Let’s embark on a journey together – a journey in which we’ll weave together the realms of basketball, fiction writing, game development and trading card games to explore how these seemingly unrelated domains surprisingly intersect with the world of software development, offering fresh perspectives and insights.
Discover how concepts, strategies, and principles from these diverse domains can enhance your software development skills and creativity. Let’s celebrate the power of interdisciplinary thinking, revealing how diverse interests can invigorate your approach to software development.
It has been far too long, more than 3.5 years since the last edition of this benchmark. Well what to say? I almost had a new edition ready a year ago and then the job hunt got too intense and now the heat wave in Berlin delayed me. You don’t want your computer running at max capacity for an extended period, trust me.
Well, you aren’t here to hear about why there hasn’t been a new edition in so long, you’re here to read about the new edition! Most likely you’re here to look at graphs and see what’s the fastest ruby implementation out there. And I swear we’ll get to it but there’s some context to establish first. Of course, feel free to skip ahead if you just want the numbers.
Well, let’s do this!
What are we benchmarking?
We’re benchmarking Rubykon again, a Go AI written in Ruby using Monte Carlo Tree Search. It’s a fun project I wrote a couple of years back. Basically it does random playouts of Go games and sees what moves lead to a winning game building a tree with different game states and their win percentages to select the best move.
Why is this a good problem to benchmark? Performance matters. The more playouts we can do the better our AI plays because we have more data for our decisions. The benchmark we’re running starts its search from an empty 19×19 board (biggest “normal” board) and does 1000 full random playouts from there. We’ll measure how long that takes/how often we could do that in a minute. This also isn’t a micro benchmark, while remaining reasonable in size it looks at lots of different methods and access patterns.
Why is this a bad problem to benchmark? Most Ruby devs are probably interested in some kind of web application performance. This does no IO (which keeps the focus on ruby code execution, which is also good) and mainly deals with arrays. While we deal with collections all the time, rubykon also accesses a lot of array indexes all over, which isn’t really that common. It also barely deals with strings. Moreover, it does a whole lot of (pseudo-)random number generation which definitely isn’t a common occurrence. It also runs a relatively tight hot loop of “generate random valid move, play it, repeat until game over”, which should be friendly to JIT approaches.
What I want to say, this is an interesting problem to benchmark but it’s probably not representative of web application performance of the different ruby implementations. It is still a good indicator of where different ruby implementations rank performance wise.
It’s also important to note that this benchmark is single threaded – while it is a problem suited for parallelization I haven’t done so yet. Plus, single threaded applications are still typical for Ruby (due to the global interpreter lock in CRuby).
We’re also mainly interested in “warm” application performance i.e. giving them a bit of time to warm up and look at their peak performance. We’ll also look at the warmup times in a separate section though.
The competitors
Our competitors are ruby variants I could easily install on my machine and was interested in which brings us to:
CRuby 2.4.10
CRuby 2.5.8
CRuby 2.6.6
CRuby 2.7.1
CRuby 2.8.0-dev (b4b702dd4f from 2020-08-07) (this might end up being called Ruby 3 not 2.8)
truffleruby-1.0.0-rc16
truffleruby-20.1.0
jruby-9.1.17.0
jruby-9.2.11.1
All of those versions were current as of early August 2020. As usual doing all the benchmarking, graphing and writing has taken me some time so that truffleruby released a new version in the mean time, result shouldn’t differ much though.
CRuby (yes I still insist on calling it that vs. MRI) is mainly our base line as it’s the standard ruby interpreter. Versions that are capable of JITing (2.6+) will also be run with the –jit flag separately to show improvement (also referred to as MJIT).
TruffleRuby was our winner the last 2 times around. We’re running 20.1 and 1.0-rc16 (please don’t ask me why this specific version, it was in the matrix from when I originally redid this benchmarks a year ago). We’re also going to run both native and JVM mode for 20.1.
JRuby will be run “normally”, and with invokedynamic + server flag (denoted by “+ID”). We’re also gonna take a look at JDK 8 and JDK 14. For JDK 14 we’re also going to run it with a non default GC algorithm, falling back to the one used in JDK 8 as the new default is slower for this benchmark. Originally I also wanted to run with lots of different JVMs but as it stands I already recorded almost 40 different runs in total and the JVMs I tried didn’t show great differences so we’ll stick with the top performer of those I tried which is AdoptOpenJDK.
This is still running on the same Desktop PC that I did the first version of these benchmarks with – almost 5 years ago. In the meantime it was hit by a lot of those lovely intel security vulnerabilities though. It’s by no means a top machine any more.
The machine has 16 GB of RAM, runs Linux Mint 19.3 (based on Ubuntu 18.04 LTS) and most importantly an i7-4790 (3.6 GHz, 4 GHz boost) (which is more than 6 years old now).
This file contains bidirectional Unicode text that may be interpreted or compiled differently than what appears below. To review, open the file in an editor that reveals hidden Unicode characters.
Learn more about bidirectional Unicode characters
Timing wise I chose 5 minutes of warmup and 2 minutes of run time measurements. The (enormous) warmup time was mostly driven by behaviour observed in TruffleRuby where sometimes it would deoptimize even after a long warmup. So, I wanted to make sure everyone had all the time they needed to reach good “warm” performance.
Run Time Results
One more thing before we get to it: JRuby here ran on AdoptOpenJDK 8. Differences to AdoptOpenJDK 14 (and other JVMs) aren’t too big and would just clutter the graphs. We’ll take a brief look at them later.
If you want to take a look at all the data I gathered you can access the spreadsheet.
Iterations per Minute per Ruby implementation for running 1000 full playouts on a 19×19 board (higher is better).
Overall this looks more or less like the graphs from the last years:
CRuby is the baseline performance without any major jumps
JRuby with invokedynamic (+ID) gets a bit more than 2x the baseline performance of CRuby, invokedynamic itself makes it a lot faster (2x+)
TruffleRuby runs away with the win
What’s new though is the inclusion of the JIT option for CRuby which performs quite impressively and is only getting better. An 18% improvement on 2.6 goes up to 34% on 2.7 and tops out at 47% for 2.8 dev when looking at the JIT vs. non JIT run times of the same Ruby version. Looking at CRuby it’s also interesting that this time around “newer” CRuby performance is largely on par with not JITed JRuby performance.
The other thing that sticks out quite hugely are those big error bars on TruffleRuby 20. This is caused by some deoptimizations even after the long warmup. Portrayed here is a run where they weren’t as bad, even if they are worse performance was still top notch at 27 i/min overall though. It’s most likely a bug that these deoptimizations happen, you can check the corresponding issue. In the past the TruffleRuby always found a way to fix issues like this. So, the theoretical performance is a bit higher.
Another thing I like to look at is the relative speedup chart:
Speedup relative to CRuby 2.4.10 (baseline)
CRuby 2.4.10 was chosen as the “baseline” for this relative speedup chart mostly as a homage to Ruby 3×3 in which the goal was for Ruby 3 to be 3 times faster than Ruby 2.0. I can’t get Ruby < 2.4 to compile on my system easily any more and hence they are sadly missing here.
I’m pretty impressed with the JIT in Ruby 2.8: a speedup of over 60% is not to be scoffed at! So, as pointed out in the results above, I have ever rising hopes for it! JRuby (with invokedynamic) sits nice and comfortably at ~2.5x speedup which is a bit down from its 3x speedup in the older benchmarks. This might also be to the improved baseline of CRuby 2.4.10 versus the old CRuby 2.0 (check the old blog post for some numbers from then, not directly comparable though). TruffleRuby sits at the top thanks to the –jvm version with almost a 6x improvement. Perhaps more impressively it’s still 2.3 times faster than the fastest non TruffleRuby implementation. The difference between “native” and –jvm for TruffleRuby is also astounding and important to keep in mind should you do your own benchmarks.
What’s a bit baffling is that the performance trend for CRuby isn’t “always getting better” like I’m used to. The differences are rather small but looking at the small standard deviation (at most less than 1%) I’m rather sure of them. 2.5 is slower than 2.4, and 2.6 is faster than both 2.7 and 2.8.-dev. However, the “proper” order is established again when enabling the JIT.
If you’re rather interested in the data table you can still check out the spreadsheet for the full data, but here’s some of it inline:
Ruby
i/min
avg (s)
stddev %
relative speedup
2.4.10
5.61
10.69
0.86
1
2.5.8
5.16
11.63
0.27
0.919786096256684
2.6.6
6.61
9.08
0.42
1.17825311942959
2.6.6 –jit
7.8
7.69
0.59
1.3903743315508
2.7.1
6.45
9.3
0.25
1.14973262032086
2.7.1 –jit
8.64
6.95
0.29
1.54010695187166
2.8.0-dev
6.28
9.56
0.32
1.11942959001783
2.8.0-dev –jit
9.25
6.48
0.29
1.64884135472371
truffleruby-1.0.0-rc16
16.55
3.63
2.19
2.95008912655971
truffleruby-20.1.0
20.22
2.97
25.82
3.60427807486631
truffleruby-20.1.0 –jvm
33.32
1.8
19.01
5.93939393939394
jruby-9.1.17.0
6.52
9.21
0.63
1.16221033868093
jruby-9.1.17.0 +ID
14.27
4.2
0.29
2.54367201426025
jruby-9.2.11.1
6.33
9.49
0.54
1.1283422459893
jruby-9.2.11.1 +ID
13.85
4.33
0.44
2.46880570409982
Warmup
Seems the JITing approaches are winning throughout, however such performance isn’t free. Conceptually, a JIT looks at what parts of your code are run often and then tries to further optimize (and often specialize) these parts of the code. This makes it a whole lot faster, this process takes time and work though.
The benchmarking numbers presented above completely ignore the startup and warmup time. The common argument for this is that in long lived applications (like most web applications) we spend the majority of time in the warmed up/hot state. It’s different when talking about scripts we run as a one off. I visualized and described the different times to measure way more in another post.
Anyhow, lets get a better feeling for those warmup times, shall we? One of my favourite methods for doing so is graphing the first couple of run times as recorded (those are all during the warmup phase):
Run times as recorded by iteration number for a few select Ruby implementations. Lower is faster/better.
CRuby itself (without –jit) performs at a steady space, this is expected as no further optimizations are done and there’s also no cache or anything involved. Your first run is pretty much gonna be as fast as your last run. It’s impressive to see though that the –jit option is faster already in the first iteration and still getting better. What you can’t see in the graph, as it doesn’t contain enough run times and the difference is very small, is that the CRuby –jit option only reaches its peak performance around iteration 19 (going from ~6.7s to ~6.5s) which is quite surprising looking at how steady it seems before that.
TruffleRuby behaves in line with previous results. It has by far the longest warmup time, especially the JVM configuration which is in line with their presented pros and cons. The –jvm runtime configuration only becomes the fastest implementation by iteration 13! Then it’s faster by quite a bit though. It’s also noteworthy that for neither native nor JVM the time declines steadily. Sometimes subsequent iterations are slower which is likely due to the JIT trying hard to optimize something or having to deoptimize something. The random nature of Rubykon might play into this, as we might be hitting edge cases only at iteration 8 or so. While especially the first run time can be quite surprising, it’s noteworthy that during my years of doing these benchmarks I’ve seen TruffleRuby steadily improve its warmup time. As a datapoint, TruffleRuby 1.0.0-rc16 had its first 2 run times at 52 seconds and 25 seconds.
JRuby is very close to peak performance after one iteration already. Peak performance with invokedynamic is hit around iteration 7. It’s noteworthy that with invokedynamic even the first iteration is faster than CRuby “normal” and on par with the CRuby JIT implementation but in subsequent iterations gets much faster than them. The non invokedynamic version is very close to normal CRuby 2.8.0-dev performance almost the entire time, except for being slower in the first iteration.
For context it’s important to point out though that Rubykon is a relatively small application. Including the benchmarking library it’s not even 1200 lines of code long. It uses no external gems, it doesn’t even access the standard library. So all of the code is in these 1200 lines + the core Ruby classes (Array etc.) which is a far cry from a full blown Rails application. More code means more things to optimize and hence should lead to much longer warmup times than presented here.
JRuby/JVM musings
It might appear unfair that the results up there were run only with JDK 8. I can assure you, in my testing it sadly isn’t. I had hoped for some big performance jumps with the new JDK versions but I found no such thing. Indeed, it features the fastest version but only by a rather slim margin. It also requires switching up the GC algorithm as the new default performs worse at least for this benchmark.
Comparison JRuby with different options against AdoptOpenJDK 8 and 14
Performance is largely the same. JDK 14 is a bit faster when using both invokedynamic and falling back to the old garbage collector (+ParallelGC). Otherwise performance is worse. You can find out more in this issue. It’s curios though that JRuby 9.1 seems mostly faster than 9.2.
I got also quite excited at first looking at all the different new JVMs and thought I’d benchmark against them all, but it quickly became apparent that this was a typical case of “matrix explosion” and I really wanted for you all to also see these results unlike last year 😅 I gathered data for GraalVM and Java Standard Edition Reference Implementation in addition to AdoptOpenJDK but performance was largely the same and best at AdoptOpenJDK on my system for this benchmark. Again, these are in the spreadsheet.
I did one more try with OpenJ9 as it sounded promising. The results were so bad I didn’t even put them into the spreadsheet (~4 i/min without invokedynamic, ~1.5 i/min with invokedynamic). I can only imagine that either I’m missing a magic switch, OpenJ9 wasn’t built with a use case such as JRuby in mind or JRuby isn’t optimized to run on OpenJ9. Perhaps all of the above.
Final Thoughts
Alright, I hope this was interesting for y’all!
What did we learn? TruffleRuby still has the best “warm” performance by a mile, warmup is getting better but can still be tricky (–> unexpected slowdowns late into the process). The JIT for CRuby seems to get better continuously and has me a bit excited. CRuby performance has caught up to JRuby out of the box (without invokedynamic). JRuby with invokedynamic is still the second fastest Ruby implementation though.
It’s also interesting to see that every Ruby implementation has at least one switch (–jit, –jvm, invokedynamic) that significantly alters performance characteristics.
Please, also don’t forget the typical grain of salt: This is one benchmark, with one rather specific use case run on one machine. Results elsewhere might differ greatly.
What else is there? Promising to redo the benchmark next year would be something, but my experience tells me not to 😉
There’s an Enterprise version of GraalVM with supposedly good performance gains. Now, I won’t be spending money but you can evaluate it for free after registering. Well, if I ever manage to fix my Oracle login and get Oracle’s permission to publish the numbers I might (I’m fairly certain I can get that though 🙂 ). I also heard rumours of some CLI flags to try with TruffleRuby to get even better numbers 🤔
Finally, this benchmark has only looked at run times which is most often the most interesting value. However, there are other numbers that could prove interesting, such as memory consumption. These aren’t as easy to break down so neatly (or I don’t know how to). Showing the maximum amount of memory consumed during the measurement could be helpful though. As some people can tell you, with Ruby it can often be that you scale up your servers due to memory constraints not necessary CPU constraints.
I’d also be interested in how a new PC (planned purchase within a year!) affects these numbers.
So, there’s definitely some future work to be done here. Anything specific you want to see? Please let me know in the comments, via Twitter or however you like. Same goes for new graph types, mistakes I made or what not – I’m here to learn!
All the way back in June 2016 I wrote a well received blog post about tail call optimization in Elixir and Erlang. It was probably the first time I really showed off my benchmarking library benchee, it was just a couple of days after the 0.2.0 release of benchee after all.
Tools should get better over time, allow you to do things easier, promote good practices or enable you to do completely new things. So how has benchee done? Here I want to take a look back and show how we’ve improved things.
What’s better now?
In the old benchmark I had to:
manually collect Opearting System, CPU as well as Elixir and Erlang version data
manually create graphs in Libreoffice from the CSV output
be reminded that performance might vary for multiple inputs
crudely measure memory consumption in one run through on the command line
The new benchee:
collects and shows system information
produces extensive HTML reports with all kinds of graphs I couldn’t even produce before
has an inputs feature encouraging me to benchmark with multiple different inputs
is capable of doing memory measurements showing me what consumers more or less memory
I think that these are all great steps forward of which I’m really proud.
This file contains bidirectional Unicode text that may be interpreted or compiled differently than what appears below. To review, open the file in an editor that reveals hidden Unicode characters. Learn more about bidirectional Unicode characters
This file contains bidirectional Unicode text that may be interpreted or compiled differently than what appears below. To review, open the file in an editor that reveals hidden Unicode characters. Learn more about bidirectional Unicode characters
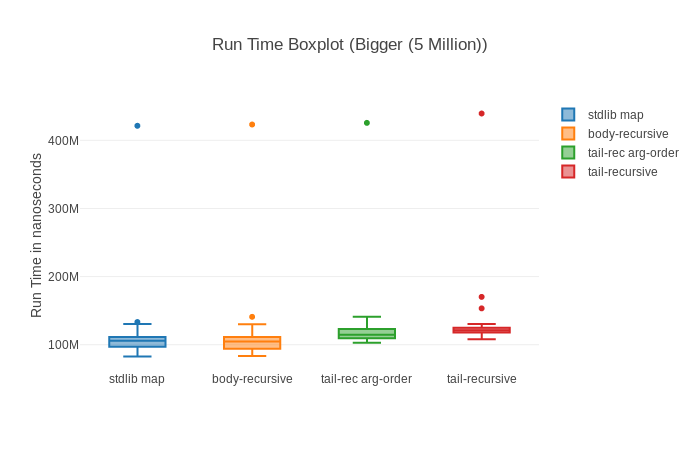
We can easily see that the tail recursive functions seem to always consume more memory. Also that our tail recursive implementation with the switched argument order is mostly faster than its sibling (always when we look at the median which is worthwhile if we want to limit the impact of outliers).
Such an (informative) wall of text! How do we spice that up a bit? How about the HTML report generated from this? It contains about the same data but is enhanced with some nice graphs for comparisons sake:
It doesn’t stop there though, some of my favourite graphs are the once looking at individual scenarios:
This Histogram shows us the distribution of the values pretty handily. We can easily see that most samples are in a 100Million – 150 Million Nanoseconds range (100-150 Milliseconds in more digestible units, scaling values in the graphs is somewhere on the road map ;))
Here we can just see the raw run times in order as they were recorded. This is helpful to potentially spot patterns like gradually increasing/decreasing run times or sudden spikes.
Something seems odd?
Speaking about spotting, have you noticed anything in those graphs? Almost all of them show that some big outliers might be around screwing with our results. The basic comparison shows pretty big standard deviation, the box plot one straight up shows outliers (little dots), the histogram show that for a long time there’s nothing and then there’s a measurement that’s much higher and in the raw run times we also see one enormous spike.
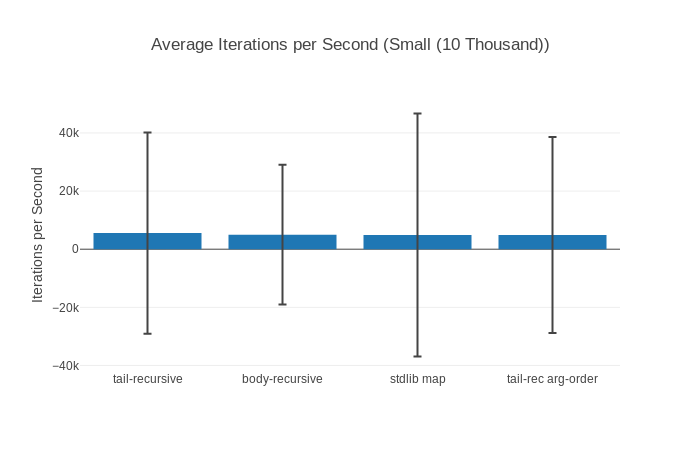
All of this is even more prevalent when we look at the graphs for the small input (10 000 elements):
Why could this be? Well, my favourite suspect in this case is garbage collection. It can take quite a while and as such is a candidate for huge outliers – the more so the faster the benchmarks are.
So let’s try to take garbage collection out of the equation. This is somewhat controversial and we can’t take it out 100%, but we can significantly limit its impact through benchee’s hooks feature. Basically through adding after_each: fn _ -> :erlang.garbage_collect() end to our configuration we tell benchee to run garbage collection after every measurement to minimize the chance that it will trigger during a measurement and hence affect results.
You can have a look at it in this HTML report. We can immediately see in the results and graphs that standard deviation got a lot smaller and we have way fewer outliers now for our smaller input sizes:
Note however that our sample size also went down significantly (from over 20 000 to… 30) so increasing benchmarking time might be worth while to get more samples again.
How does it look like for our big 5 Million input though?
Not much of an improvement… Actually slightly worse. Strange. We can find the likely answer in the raw run time graphs of all of our contenders:
The first sample is always the slowest (while running with GC it seemed to be the third run). My theory is that for the larger amount of data the BEAM needs to repeatedly grow the memory of the process we are benchmarking. This seems strange though, as that should have already happened during warmup (benchee uses one process for each scenario which includes warmup and run time). It might be something different, but it very likely is a one time cost.
To GC or not to GC
Is a good question. Especially for very micro benchmarks it can help stabilize/sanitize the measured times. Due to the high standard deviation/outliers whoever is fastest can change quite a lot on repeated runs.
However, Garbage Collection happens in a real world scenario and the amount of “garbage” you produce can often be directly linked to your run time – taking the cleaning time out of equation can yield results that are not necessarily applicable to the real world. You could also significantly increase the run time to level the playing field so that by the law of big numbers we come closer to the true average – spikes from garbage collection or not.
Wrapping up
Anyhow, this was just a little detour to show how some of these graphs can help us drill down and find out why our measurements are as they are and find likely causes.
The improvements in benchee mean the promotion of better practices and much less manual work. In essence I could just link the HTML report and then just discuss the topic at hand (well save the benchmarking code, that’s not in there… yet 😉 ) which is great for publishing benchmarks. Speaking about discussions, I omitted the discussions around tail recursive calls etc. with comments from José Valim and Robert Virding. Feel free to still read the old blog post for that – it’s not that old after all.
I had a wonderful time at Ruby On Ice! I gave a talk, that I loved to prepare to formulate the ideas the right way. You’ll see it focuses a lot on the problems, that’s intentional because if we’re not clear on the problems what good is a solution?
You can find the video along with awesome sketch notes on the Ruby on Ice homepage.
(in case you wonder why the first slide is a beer, the talk was given on Sunday Morning as the first talk after the party – welcoming people back was essential as I was a bit afraid not many would show up but they did!)
Abstract
Rails apps start nice and cute. Fast forward a year and business logic and view logic are entangled in our validations and callbacks – getting in our way at every turn. Wasn’t this supposed to be easy?
Let’s explore different approaches to improve the situation and untangle the web.
I was supposed to give this talk at ElixirConf.Eu, but sadly fell ill. These are the slides (still titled alpha-1) that I used to give it Elixir Berlin which was met with a great reception. Which is also why I was so looking forward to give it again and have it recorded… Anyhow, if you saw the talk and want to go through the slides again or you were looking forward to the slides – here they are.
Elixir is great, so clearly we’ll all rewrite our applications in Elixir. Mostly, you can’t and shouldn’t do that. This presentation will show you another path. You’ll see how at Liefery, we started with small steps instead of rewriting everything. This allowed us to reap the benefits earlier and get comfortable before getting deeper into it. We’ll examine in detail the tactics we used to create two Elixir apps for new requirements, and how we integrated them with our existing Rails code base.
Join us on our tale of adopting Elixir and Phoenix and see what we learned, what we loved, and what bumps we hit along the road
edit: slightly updated version from devday.io – PDFslideshare
I gave my first ever keynote yesterday at Ruby on Ice, which was a lot of fun. A lot of the talk is based on my “Where do Rubyists go?”-survey but also researching and looking into languages. The talk looks into what programming languages Ruby developers learn for work or in their free time, what the major features of those languages are and how that compares to Ruby. What does it tell us about Ruby and our community?
Many Rubyists branch out and take a look at other languages. What are similarities between those languages and ruby? What are differences? How does Ruby influence these languages?
Lately I acquired a new hobby. I went around and asked experience Rails developers, whom I respect and value a lot, how many users the following script would create:
This file contains bidirectional Unicode text that may be interpreted or compiled differently than what appears below. To review, open the file in an editor that reveals hidden Unicode characters. Learn more about bidirectional Unicode characters
The result should be the same on pretty much any database and any Rails version. For the sake of argument you can assume Rails 5.1 and Postgres 9.6 (what I tested it with).
So, how many users does it create? No one from more than a hand full of people I asked got the answer right (including myself).
The answer is 2.
Wait, WHAT?
Yup you read that right. It creates 2 users, the rollback is effectively useless here. Ideally this should create one user (Kotori), but as some people know nested transactions isn’t really a thing that databases support (save for MS-SQL apparently). People, whom I asked and knew this, then guessed 0 because well if I can’t rollback a part of it, better safe than sorry and roll all of it back, right?
Well, sadly the inner transaction rescues the rollback and then the outer transaction happily commits all of it. 😦
Before you get all worried – if an exception is raised and not caught the outer transaction can’t commit and hence 0 users are created as expected.
A fix
So, what can we do? When opening a transaction, we can pass requires_new: true to the transaction which will emulate a “real” nested transaction using savepoints:
This file contains bidirectional Unicode text that may be interpreted or compiled differently than what appears below. To review, open the file in an editor that reveals hidden Unicode characters. Learn more about bidirectional Unicode characters
Nah, doesn’t concern me I’d never write code like this!
Sure, you probably straight up won’t write code like this in a file. However, split across multiple files – I think so. You have one unit of business logic that you want to run in a transaction and then you start reusing it in another method that’s also wrapped in another transaction. Happens more often than you think.
Plus it can happen even more often than that as every save operation is wrapped in its own transaction (for good reasons). That means, as soon as you save anything inside a transaction or you save/update records as part of a callback you might run into this problem.
Here’s a small example highlighting the problem:
This file contains bidirectional Unicode text that may be interpreted or compiled differently than what appears below. To review, open the file in an editor that reveals hidden Unicode characters. Learn more about bidirectional Unicode characters
This file contains bidirectional Unicode text that may be interpreted or compiled differently than what appears below. To review, open the file in an editor that reveals hidden Unicode characters. Learn more about bidirectional Unicode characters
As you probably expect by now this creates 2 users. And yes, I checked – if you run create with rollback: true outside of the transaction no user is created. Of course, you shouldn’t raise rollbacks in callbacks but I’m sure that someone somewhere does it.
In case you want to play with this, all of these examples (+ more) are up at my rails playground.
The saddest part of this surprise…
Unless you stumbled across this before, chances are this is at least somewhat surprising to you. If you knew this before, kudos to you. The saddest part is that this shouldn’t be a surprise to anyone though. A lot of what is written here is part of the official documentation, including the exact example I used. It introduces the example with the following wonderful sentence:
For example, the following behavior may be surprising:
Why do I even blog about this when it’s in the official documentation all along? I think this deserves more attention and more people should know about it to avoid truly bad surprises. The fact that nobody I asked knew the answer encouraged me to write this. We should all take care to read the documentation of software we use more, we might find something interesting you know.