Tail-Recursive & Body-Recursive Function Performance Across Elixir & BEAM versions – what’s the impact of the JIT?

I’ve wanted to revisit “Tail Call Optimization in Elixir & Erlang – not as efficient and important as you probably think” (2016) for a while – so much so that I already revisited it once ~5 years ago to show off some benchee 1.0 features. As a reminder, in these the results were:

  • body-recursive was fastest on input sizes of lists the size of 100k and 5M, but slower on the smallest input (10k list) and the biggest input (25M list). The difference either way was usually in the ~5% to 20% range.
  • tail-recursive functions consumed significantly more memory
  • we found that the order of the arguments for the tail-recusive function has a measurable impact on performance – namely doing the pattern match on the first argument of the recursive function was faster.

So, why should we revisit it again? Well, since then then JIT was introduced in OTP 24. And so, as our implementation changes, performance properties of functions may change over time. And, little spoiler, change they did.

To illustrate how performance changes across versions I wanted to show the performance across many different Elixir & OTP versions, I settled on the following ones:

  • Elixir 1.6 @ OTP 21.3 – the oldest version I could get running without too much hassle
  • Elixir 1.13 @ OTP 23.3 – the last OTP version before the JIT introduction
  • Elixir 1.13 @ OTP 24.3 – the first major OTP version with the JIT (decided to use the newest minor though), using the same Elixir version as above so that the difference is up to OTP
  • Elixir 1.16 @ OTP 26.2 – the most current Elixir & Erlang versions as of this writing

How do the performance characteristics change over time? Are we getting faster with time? Let’s find out! But first let’s discuss the benchmark.

The Benchmark

You can find the code in this repo. The implementations are still the same as last time. I dropped the “stdlib”/Enum.map part of the benchmark though as in the past it showed similar performance characteristics as the body-recursive implementation. It was also the only one not implemented “by hand”, more of a “gold-standard” to benchmark against. Hence it doesn’t hold too much value when discussing “which one of these simple hand-coded solutions is fastest?”.

It’s also worth nothing that this time the benchmarks are running on a new PC. Well, not new-new, it’s from 2020 but still a different one that the previous 2 benchmarks were run on.

System information
Operating System: Linux
CPU Information: AMD Ryzen 9 5900X 12-Core Processor
Number of Available Cores: 24
Available memory: 31.25 GB

As per usual, these benchmarks were run on an idle system with no other necessary applications running – not even a UI.

Without further ado the benchmarking script itself:

map_fun = fn i -> i + 1 end
inputs = [
{"Small (10 Thousand)", Enum.to_list(1..10_000)},
{"Middle (100 Thousand)", Enum.to_list(1..100_000)},
{"Big (1 Million)", Enum.to_list(1..1_000_000)},
{"Giant (10 Million)", Enum.to_list(1..10_000_000)},
{"Titanic (50 Million)", Enum.to_list(1..50_000_000)}
]
tag = System.get_env("TAG")
Benchee.run(
%{
"tail" => fn list -> MyMap.map_tco(list, map_fun) end,
"body" => fn list -> MyMap.map_body(list, map_fun) end,
"tail +order" => fn list -> MyMap.map_tco_arg_order(list, map_fun) end
},
warmup: 5,
time: 40,
# memory measurements are stable/all the same
memory_time: 0.1,
inputs: inputs,
formatters: [
{Benchee.Formatters.Console, extended_statistics: true}
],
save: [tag: tag, path: "benchmarks/saves/tco_#{tag}.benchee"]
)

The script is fairly standard, except for long benchmarking times and a lot of inputs. The TAG environment variable has to do with the script that runs the benchmark across the different elixir & OTP versions. I might dig into that in a later blog post – but it’s just there to save them into different files and tag them with the respective version.

Also tail + order denotes the version that switched the order of the arguments around to pattern match on the first argument, as talked about before when recapping earlier results.

Results

As usual you can peruse the full benchmarking results in the HTML reports or the console output here:

Console Output of the benchmark
##### With input Small (10 Thousand) #####
Name                                  ips        average  deviation         median         99th %
tail +order (1.16.0-otp-26)       11.48 K       87.10 μs   ±368.22%       72.35 μs      131.61 μs
tail (1.16.0-otp-26)              10.56 K       94.70 μs   ±126.50%       79.80 μs      139.20 μs
tail +order (1.13.4-otp-24)       10.20 K       98.01 μs   ±236.80%       84.80 μs      141.84 μs
tail (1.13.4-otp-24)              10.17 K       98.37 μs    ±70.24%       85.55 μs      143.28 μs
body (1.16.0-otp-26)               8.61 K      116.19 μs    ±18.37%      118.16 μs      167.50 μs
body (1.13.4-otp-24)               7.60 K      131.50 μs    ±13.94%      129.71 μs      192.96 μs
tail +order (1.13.4-otp-23)        7.34 K      136.32 μs   ±232.24%      120.61 μs      202.73 μs
body (1.13.4-otp-23)               6.51 K      153.55 μs     ±9.75%      153.70 μs      165.62 μs
tail +order (1.6.6-otp-21)         6.36 K      157.14 μs   ±175.28%      142.99 μs      240.49 μs
tail (1.13.4-otp-23)               6.25 K      159.92 μs   ±116.12%      154.20 μs      253.37 μs
body (1.6.6-otp-21)                6.23 K      160.49 μs     ±9.88%      159.88 μs      170.30 μs
tail (1.6.6-otp-21)                5.83 K      171.54 μs    ±71.94%      158.44 μs      256.83 μs

Comparison: 
tail +order (1.16.0-otp-26)       11.48 K
tail (1.16.0-otp-26)              10.56 K - 1.09x slower +7.60 μs
tail +order (1.13.4-otp-24)       10.20 K - 1.13x slower +10.91 μs
tail (1.13.4-otp-24)              10.17 K - 1.13x slower +11.27 μs
body (1.16.0-otp-26)               8.61 K - 1.33x slower +29.09 μs
body (1.13.4-otp-24)               7.60 K - 1.51x slower +44.40 μs
tail +order (1.13.4-otp-23)        7.34 K - 1.57x slower +49.22 μs
body (1.13.4-otp-23)               6.51 K - 1.76x slower +66.44 μs
tail +order (1.6.6-otp-21)         6.36 K - 1.80x slower +70.04 μs
tail (1.13.4-otp-23)               6.25 K - 1.84x slower +72.82 μs
body (1.6.6-otp-21)                6.23 K - 1.84x slower +73.38 μs
tail (1.6.6-otp-21)                5.83 K - 1.97x slower +84.44 μs

Extended statistics: 

Name                                minimum        maximum    sample size                     mode
tail +order (1.16.0-otp-26)        68.68 μs   200466.90 μs       457.09 K                 71.78 μs
tail (1.16.0-otp-26)               75.70 μs    64483.82 μs       420.52 K       79.35 μs, 79.36 μs
tail +order (1.13.4-otp-24)        79.22 μs   123986.92 μs       405.92 K                 81.91 μs
tail (1.13.4-otp-24)               81.05 μs    41801.49 μs       404.37 K                 82.62 μs
body (1.16.0-otp-26)               83.71 μs     5156.24 μs       343.07 K                 86.39 μs
body (1.13.4-otp-24)              106.46 μs     5935.86 μs       302.92 K125.90 μs, 125.72 μs, 125
tail +order (1.13.4-otp-23)       106.66 μs   168040.73 μs       292.04 K                109.26 μs
body (1.13.4-otp-23)              139.84 μs     5164.72 μs       259.47 K                147.51 μs
tail +order (1.6.6-otp-21)        122.31 μs   101605.07 μs       253.46 K                138.40 μs
tail (1.13.4-otp-23)              115.74 μs    47040.19 μs       249.14 K                125.40 μs
body (1.6.6-otp-21)               109.67 μs     4938.61 μs       248.26 K                159.82 μs
tail (1.6.6-otp-21)               121.83 μs    40861.21 μs       232.24 K                157.72 μs

Memory usage statistics:

Name                           Memory usage
tail +order (1.16.0-otp-26)       223.98 KB
tail (1.16.0-otp-26)              223.98 KB - 1.00x memory usage +0 KB
tail +order (1.13.4-otp-24)       223.98 KB - 1.00x memory usage +0 KB
tail (1.13.4-otp-24)              223.98 KB - 1.00x memory usage +0 KB
body (1.16.0-otp-26)              156.25 KB - 0.70x memory usage -67.73438 KB
body (1.13.4-otp-24)              156.25 KB - 0.70x memory usage -67.73438 KB
tail +order (1.13.4-otp-23)       224.02 KB - 1.00x memory usage +0.0313 KB
body (1.13.4-otp-23)              156.25 KB - 0.70x memory usage -67.73438 KB
tail +order (1.6.6-otp-21)        224.03 KB - 1.00x memory usage +0.0469 KB
tail (1.13.4-otp-23)              224.02 KB - 1.00x memory usage +0.0313 KB
body (1.6.6-otp-21)               156.25 KB - 0.70x memory usage -67.73438 KB
tail (1.6.6-otp-21)               224.03 KB - 1.00x memory usage +0.0469 KB

**All measurements for memory usage were the same**

##### With input Middle (100 Thousand) #####
Name                                  ips        average  deviation         median         99th %
tail +order (1.16.0-otp-26)        823.46        1.21 ms    ±33.74%        1.17 ms        2.88 ms
tail (1.16.0-otp-26)               765.87        1.31 ms    ±32.35%        1.25 ms        2.99 ms
body (1.16.0-otp-26)               715.86        1.40 ms    ±10.19%        1.35 ms        1.57 ms
body (1.13.4-otp-24)               690.92        1.45 ms    ±10.57%        1.56 ms        1.64 ms
tail +order (1.13.4-otp-24)        636.45        1.57 ms    ±42.91%        1.33 ms        3.45 ms
tail (1.13.4-otp-24)               629.78        1.59 ms    ±42.61%        1.36 ms        3.45 ms
body (1.13.4-otp-23)               625.42        1.60 ms     ±9.95%        1.68 ms        1.79 ms
body (1.6.6-otp-21)                589.10        1.70 ms     ±9.69%        1.65 ms        1.92 ms
tail +order (1.6.6-otp-21)         534.56        1.87 ms    ±25.30%        2.22 ms        2.44 ms
tail (1.13.4-otp-23)               514.88        1.94 ms    ±23.90%        2.31 ms        2.47 ms
tail (1.6.6-otp-21)                514.64        1.94 ms    ±24.51%        2.21 ms        2.71 ms
tail +order (1.13.4-otp-23)        513.89        1.95 ms    ±23.73%        2.23 ms        2.47 ms

Comparison: 
tail +order (1.16.0-otp-26)        823.46
tail (1.16.0-otp-26)               765.87 - 1.08x slower +0.0913 ms
body (1.16.0-otp-26)               715.86 - 1.15x slower +0.183 ms
body (1.13.4-otp-24)               690.92 - 1.19x slower +0.23 ms
tail +order (1.13.4-otp-24)        636.45 - 1.29x slower +0.36 ms
tail (1.13.4-otp-24)               629.78 - 1.31x slower +0.37 ms
body (1.13.4-otp-23)               625.42 - 1.32x slower +0.38 ms
body (1.6.6-otp-21)                589.10 - 1.40x slower +0.48 ms
tail +order (1.6.6-otp-21)         534.56 - 1.54x slower +0.66 ms
tail (1.13.4-otp-23)               514.88 - 1.60x slower +0.73 ms
tail (1.6.6-otp-21)                514.64 - 1.60x slower +0.73 ms
tail +order (1.13.4-otp-23)        513.89 - 1.60x slower +0.73 ms

Extended statistics: 

Name                                minimum        maximum    sample size                     mode
tail +order (1.16.0-otp-26)         0.70 ms        5.88 ms        32.92 K                  0.71 ms
tail (1.16.0-otp-26)                0.77 ms        5.91 ms        30.62 K                  0.78 ms
body (1.16.0-otp-26)                0.90 ms        3.82 ms        28.62 K         1.51 ms, 1.28 ms
body (1.13.4-otp-24)                1.29 ms        3.77 ms        27.62 K         1.30 ms, 1.31 ms
tail +order (1.13.4-otp-24)         0.79 ms        6.21 ms        25.44 K1.32 ms, 1.32 ms, 1.32 ms
tail (1.13.4-otp-24)                0.80 ms        6.20 ms        25.18 K                  1.36 ms
body (1.13.4-otp-23)                1.44 ms        4.77 ms        25.00 K         1.45 ms, 1.45 ms
body (1.6.6-otp-21)                 1.39 ms        5.06 ms        23.55 K                  1.64 ms
tail +order (1.6.6-otp-21)          1.28 ms        4.67 ms        21.37 K                  1.42 ms
tail (1.13.4-otp-23)                1.43 ms        4.65 ms        20.59 K         1.44 ms, 1.44 ms
tail (1.6.6-otp-21)                 1.11 ms        4.33 ms        20.58 K                  1.40 ms
tail +order (1.13.4-otp-23)         1.26 ms        4.67 ms        20.55 K                  1.52 ms

Memory usage statistics:

Name                           Memory usage
tail +order (1.16.0-otp-26)         2.90 MB
tail (1.16.0-otp-26)                2.90 MB - 1.00x memory usage +0 MB
body (1.16.0-otp-26)                1.53 MB - 0.53x memory usage -1.37144 MB
body (1.13.4-otp-24)                1.53 MB - 0.53x memory usage -1.37144 MB
tail +order (1.13.4-otp-24)         2.93 MB - 1.01x memory usage +0.0354 MB
tail (1.13.4-otp-24)                2.93 MB - 1.01x memory usage +0.0354 MB
body (1.13.4-otp-23)                1.53 MB - 0.53x memory usage -1.37144 MB
body (1.6.6-otp-21)                 1.53 MB - 0.53x memory usage -1.37144 MB
tail +order (1.6.6-otp-21)          2.89 MB - 1.00x memory usage -0.00793 MB
tail (1.13.4-otp-23)                2.89 MB - 1.00x memory usage -0.01099 MB
tail (1.6.6-otp-21)                 2.89 MB - 1.00x memory usage -0.00793 MB
tail +order (1.13.4-otp-23)         2.89 MB - 1.00x memory usage -0.01099 MB

**All measurements for memory usage were the same**

##### With input Big (1 Million) #####
Name                                  ips        average  deviation         median         99th %
tail (1.13.4-otp-24)                41.07       24.35 ms    ±33.92%       24.44 ms       47.47 ms
tail +order (1.13.4-otp-24)         40.37       24.77 ms    ±34.43%       24.40 ms       48.88 ms
tail +order (1.16.0-otp-26)         37.60       26.60 ms    ±34.40%       24.86 ms       46.90 ms
tail (1.16.0-otp-26)                37.59       26.60 ms    ±36.56%       24.57 ms       52.22 ms
tail +order (1.6.6-otp-21)          34.05       29.37 ms    ±27.14%       30.79 ms       56.63 ms
tail (1.13.4-otp-23)                33.41       29.93 ms    ±24.80%       31.17 ms       50.95 ms
tail +order (1.13.4-otp-23)         32.01       31.24 ms    ±24.13%       32.78 ms       56.27 ms
tail (1.6.6-otp-21)                 30.59       32.69 ms    ±23.49%       33.78 ms       59.07 ms
body (1.13.4-otp-23)                26.93       37.13 ms     ±4.54%       37.51 ms       39.63 ms
body (1.16.0-otp-26)                26.65       37.52 ms     ±7.09%       38.36 ms       41.84 ms
body (1.6.6-otp-21)                 26.32       38.00 ms     ±4.56%       38.02 ms       43.01 ms
body (1.13.4-otp-24)                17.90       55.86 ms     ±3.63%       55.74 ms       63.59 ms

Comparison: 
tail (1.13.4-otp-24)                41.07
tail +order (1.13.4-otp-24)         40.37 - 1.02x slower +0.43 ms
tail +order (1.16.0-otp-26)         37.60 - 1.09x slower +2.25 ms
tail (1.16.0-otp-26)                37.59 - 1.09x slower +2.25 ms
tail +order (1.6.6-otp-21)          34.05 - 1.21x slower +5.02 ms
tail (1.13.4-otp-23)                33.41 - 1.23x slower +5.58 ms
tail +order (1.13.4-otp-23)         32.01 - 1.28x slower +6.89 ms
tail (1.6.6-otp-21)                 30.59 - 1.34x slower +8.34 ms
body (1.13.4-otp-23)                26.93 - 1.53x slower +12.79 ms
body (1.16.0-otp-26)                26.65 - 1.54x slower +13.17 ms
body (1.6.6-otp-21)                 26.32 - 1.56x slower +13.65 ms
body (1.13.4-otp-24)                17.90 - 2.29x slower +31.51 ms

Extended statistics: 

Name                                minimum        maximum    sample size                     mode
tail (1.13.4-otp-24)                8.31 ms       68.32 ms         1.64 K                     None
tail +order (1.13.4-otp-24)         8.36 ms       72.16 ms         1.62 K       33.33 ms, 15.15 ms
tail +order (1.16.0-otp-26)         7.25 ms       61.46 ms         1.50 K                 26.92 ms
tail (1.16.0-otp-26)                8.04 ms       56.17 ms         1.50 K                     None
tail +order (1.6.6-otp-21)         11.20 ms       69.86 ms         1.36 K                 37.39 ms
tail (1.13.4-otp-23)               12.47 ms       60.67 ms         1.34 K                     None
tail +order (1.13.4-otp-23)        13.06 ms       74.43 ms         1.28 K                 23.27 ms
tail (1.6.6-otp-21)                15.17 ms       73.09 ms         1.22 K                     None
body (1.13.4-otp-23)               20.90 ms       56.89 ms         1.08 K                 38.11 ms
body (1.16.0-otp-26)               19.23 ms       57.76 ms         1.07 K                     None
body (1.6.6-otp-21)                19.81 ms       55.04 ms         1.05 K                     None
body (1.13.4-otp-24)               19.36 ms       72.21 ms            716                     None

Memory usage statistics:

Name                           Memory usage
tail (1.13.4-otp-24)               26.95 MB
tail +order (1.13.4-otp-24)        26.95 MB - 1.00x memory usage +0 MB
tail +order (1.16.0-otp-26)        26.95 MB - 1.00x memory usage +0.00015 MB
tail (1.16.0-otp-26)               26.95 MB - 1.00x memory usage +0.00015 MB
tail +order (1.6.6-otp-21)         26.95 MB - 1.00x memory usage +0.00031 MB
tail (1.13.4-otp-23)               26.95 MB - 1.00x memory usage +0.00029 MB
tail +order (1.13.4-otp-23)        26.95 MB - 1.00x memory usage +0.00029 MB
tail (1.6.6-otp-21)                26.95 MB - 1.00x memory usage +0.00031 MB
body (1.13.4-otp-23)               15.26 MB - 0.57x memory usage -11.69537 MB
body (1.16.0-otp-26)               15.26 MB - 0.57x memory usage -11.69537 MB
body (1.6.6-otp-21)                15.26 MB - 0.57x memory usage -11.69537 MB
body (1.13.4-otp-24)               15.26 MB - 0.57x memory usage -11.69537 MB

**All measurements for memory usage were the same**

##### With input Giant (10 Million) #####
Name                                  ips        average  deviation         median         99th %
tail (1.16.0-otp-26)                 8.59      116.36 ms    ±24.44%      111.06 ms      297.27 ms
tail +order (1.16.0-otp-26)          8.07      123.89 ms    ±39.11%      103.42 ms      313.82 ms
tail +order (1.13.4-otp-23)          5.15      194.07 ms    ±28.32%      171.83 ms      385.56 ms
tail (1.13.4-otp-23)                 5.05      197.91 ms    ±26.21%      179.95 ms      368.95 ms
tail (1.13.4-otp-24)                 4.82      207.47 ms    ±31.62%      184.35 ms      444.05 ms
tail +order (1.13.4-otp-24)          4.77      209.59 ms    ±31.01%      187.04 ms      441.28 ms
tail (1.6.6-otp-21)                  4.76      210.30 ms    ±26.31%      189.71 ms      406.29 ms
tail +order (1.6.6-otp-21)           4.15      240.89 ms    ±28.46%      222.87 ms      462.93 ms
body (1.6.6-otp-21)                  2.50      399.78 ms     ±9.42%      397.69 ms      486.53 ms
body (1.13.4-otp-23)                 2.50      399.88 ms     ±7.58%      400.23 ms      471.07 ms
body (1.16.0-otp-26)                 2.27      440.73 ms     ±9.60%      445.77 ms      511.66 ms
body (1.13.4-otp-24)                 2.10      476.77 ms     ±7.72%      476.57 ms      526.09 ms

Comparison: 
tail (1.16.0-otp-26)                 8.59
tail +order (1.16.0-otp-26)          8.07 - 1.06x slower +7.53 ms
tail +order (1.13.4-otp-23)          5.15 - 1.67x slower +77.71 ms
tail (1.13.4-otp-23)                 5.05 - 1.70x slower +81.55 ms
tail (1.13.4-otp-24)                 4.82 - 1.78x slower +91.11 ms
tail +order (1.13.4-otp-24)          4.77 - 1.80x slower +93.23 ms
tail (1.6.6-otp-21)                  4.76 - 1.81x slower +93.94 ms
tail +order (1.6.6-otp-21)           4.15 - 2.07x slower +124.53 ms
body (1.6.6-otp-21)                  2.50 - 3.44x slower +283.42 ms
body (1.13.4-otp-23)                 2.50 - 3.44x slower +283.52 ms
body (1.16.0-otp-26)                 2.27 - 3.79x slower +324.37 ms
body (1.13.4-otp-24)                 2.10 - 4.10x slower +360.41 ms

Extended statistics: 

Name                                minimum        maximum    sample size                     mode
tail (1.16.0-otp-26)               81.09 ms      379.73 ms            343                     None
tail +order (1.16.0-otp-26)        74.87 ms      407.68 ms            322                     None
tail +order (1.13.4-otp-23)       129.96 ms      399.67 ms            206                     None
tail (1.13.4-otp-23)              120.60 ms      429.31 ms            203                     None
tail (1.13.4-otp-24)               85.42 ms      494.75 ms            193                     None
tail +order (1.13.4-otp-24)        86.99 ms      477.82 ms            191                     None
tail (1.6.6-otp-21)               131.60 ms      450.47 ms            190                224.04 ms
tail +order (1.6.6-otp-21)        124.69 ms      513.50 ms            166                     None
body (1.6.6-otp-21)               207.61 ms      486.65 ms            100                     None
body (1.13.4-otp-23)              200.16 ms      471.13 ms            100                     None
body (1.16.0-otp-26)              202.63 ms      511.66 ms             91                     None
body (1.13.4-otp-24)              200.17 ms      526.09 ms             84                     None

Memory usage statistics:

Name                           Memory usage
tail (1.16.0-otp-26)              303.85 MB
tail +order (1.16.0-otp-26)       303.85 MB - 1.00x memory usage +0 MB
tail +order (1.13.4-otp-23)       303.79 MB - 1.00x memory usage -0.06104 MB
tail (1.13.4-otp-23)              303.79 MB - 1.00x memory usage -0.06104 MB
tail (1.13.4-otp-24)              301.64 MB - 0.99x memory usage -2.21191 MB
tail +order (1.13.4-otp-24)       301.64 MB - 0.99x memory usage -2.21191 MB
tail (1.6.6-otp-21)               303.77 MB - 1.00x memory usage -0.07690 MB
tail +order (1.6.6-otp-21)        303.77 MB - 1.00x memory usage -0.07690 MB
body (1.6.6-otp-21)               152.59 MB - 0.50x memory usage -151.25967 MB
body (1.13.4-otp-23)              152.59 MB - 0.50x memory usage -151.25967 MB
body (1.16.0-otp-26)              152.59 MB - 0.50x memory usage -151.25967 MB
body (1.13.4-otp-24)              152.59 MB - 0.50x memory usage -151.25967 MB

**All measurements for memory usage were the same**

##### With input Titanic (50 Million) #####
Name                                  ips        average  deviation         median         99th %
tail (1.13.4-otp-24)                 0.85         1.18 s    ±26.26%         1.11 s         2.00 s
tail +order (1.16.0-otp-26)          0.85         1.18 s    ±28.67%         1.21 s         1.91 s
tail (1.16.0-otp-26)                 0.84         1.18 s    ±28.05%         1.18 s         1.97 s
tail +order (1.13.4-otp-24)          0.82         1.22 s    ±27.20%         1.13 s         2.04 s
tail (1.13.4-otp-23)                 0.79         1.26 s    ±24.44%         1.25 s         1.88 s
tail +order (1.13.4-otp-23)          0.79         1.27 s    ±22.64%         1.26 s         1.93 s
tail +order (1.6.6-otp-21)           0.76         1.32 s    ±17.39%         1.37 s         1.83 s
tail (1.6.6-otp-21)                  0.75         1.33 s    ±18.22%         1.39 s         1.86 s
body (1.6.6-otp-21)                  0.58         1.73 s    ±15.01%         1.83 s         2.23 s
body (1.13.4-otp-23)                 0.55         1.81 s    ±19.33%         1.90 s         2.25 s
body (1.16.0-otp-26)                 0.53         1.88 s    ±16.13%         1.96 s         2.38 s
body (1.13.4-otp-24)                 0.44         2.28 s    ±17.61%         2.46 s         2.58 s

Comparison: 
tail (1.13.4-otp-24)                 0.85
tail +order (1.16.0-otp-26)          0.85 - 1.00x slower +0.00085 s
tail (1.16.0-otp-26)                 0.84 - 1.01x slower +0.00803 s
tail +order (1.13.4-otp-24)          0.82 - 1.04x slower +0.0422 s
tail (1.13.4-otp-23)                 0.79 - 1.07x slower +0.0821 s
tail +order (1.13.4-otp-23)          0.79 - 1.08x slower +0.0952 s
tail +order (1.6.6-otp-21)           0.76 - 1.12x slower +0.145 s
tail (1.6.6-otp-21)                  0.75 - 1.13x slower +0.152 s
body (1.6.6-otp-21)                  0.58 - 1.47x slower +0.55 s
body (1.13.4-otp-23)                 0.55 - 1.54x slower +0.63 s
body (1.16.0-otp-26)                 0.53 - 1.59x slower +0.70 s
body (1.13.4-otp-24)                 0.44 - 1.94x slower +1.10 s

Extended statistics: 

Name                                minimum        maximum    sample size                     mode
tail (1.13.4-otp-24)                 0.84 s         2.00 s             34                     None
tail +order (1.16.0-otp-26)          0.38 s         1.91 s             34                     None
tail (1.16.0-otp-26)                 0.41 s         1.97 s             34                     None
tail +order (1.13.4-otp-24)          0.83 s         2.04 s             33                     None
tail (1.13.4-otp-23)                 0.73 s         1.88 s             32                     None
tail +order (1.13.4-otp-23)          0.71 s         1.93 s             32                     None
tail +order (1.6.6-otp-21)           0.87 s         1.83 s             31                     None
tail (1.6.6-otp-21)                  0.90 s         1.86 s             30                     None
body (1.6.6-otp-21)                  0.87 s         2.23 s             24                     None
body (1.13.4-otp-23)                 0.85 s         2.25 s             22                     None
body (1.16.0-otp-26)                 1.00 s         2.38 s             22                     None
body (1.13.4-otp-24)                 1.02 s         2.58 s             18                     None

Memory usage statistics:

Name                           Memory usage
tail (1.13.4-otp-24)                1.49 GB
tail +order (1.16.0-otp-26)         1.49 GB - 1.00x memory usage -0.00085 GB
tail (1.16.0-otp-26)                1.49 GB - 1.00x memory usage -0.00085 GB
tail +order (1.13.4-otp-24)         1.49 GB - 1.00x memory usage +0 GB
tail (1.13.4-otp-23)                1.49 GB - 1.00x memory usage +0.00161 GB
tail +order (1.13.4-otp-23)         1.49 GB - 1.00x memory usage +0.00161 GB
tail +order (1.6.6-otp-21)          1.49 GB - 1.00x memory usage +0.00151 GB
tail (1.6.6-otp-21)                 1.49 GB - 1.00x memory usage +0.00151 GB
body (1.6.6-otp-21)                 0.75 GB - 0.50x memory usage -0.74222 GB
body (1.13.4-otp-23)                0.75 GB - 0.50x memory usage -0.74222 GB
body (1.16.0-otp-26)                0.75 GB - 0.50x memory usage -0.74222 GB
body (1.13.4-otp-24)                0.75 GB - 0.50x memory usage -0.74222 GB

So, what are our key findings?

Tail-Recursive Functions with Elixir 1.16 @ OTP 26.2 are fastest

For all but one input elixir 1.16 @ OTP 26.2 is the fastest implementation or virtually tied with the fastest implementation. It’s great to know that our most recent version brings us some speed goodies!

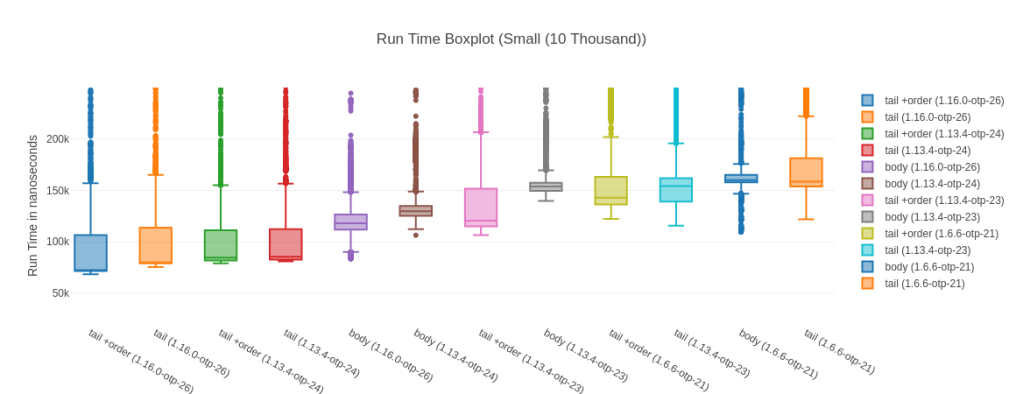
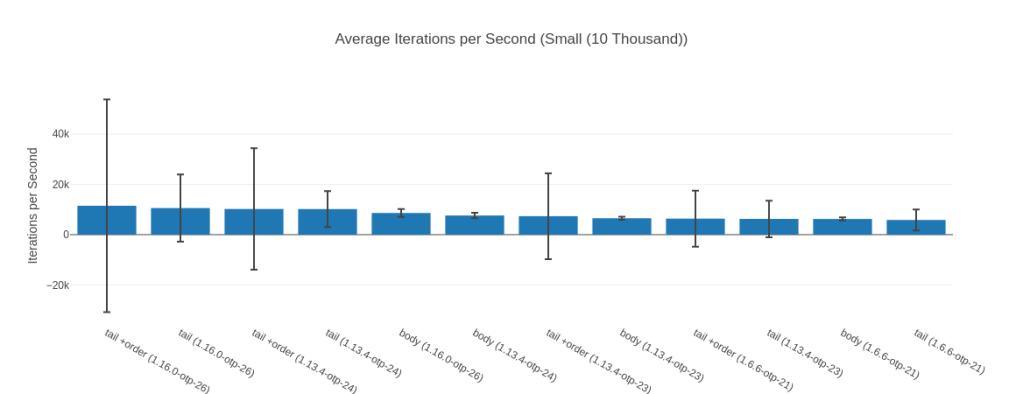
Is that the impact of the JIT you may ask? It can certainly seem so – when we’re looking at the list with 10 000 elements as input we see that even the slowest JIT implementation is faster than the fastest non-JIT implementation (remember, the JIT was introduced in OTP 24):

Table with more detailed data
NameIterations per SecondAverageDeviationMedianModeMinimumMaximumSample size
tail +order (1.16.0-otp-26)11.48 K87.10 μs±368.22%72.35 μs71.78 μs68.68 μs200466.90 μs457086
tail (1.16.0-otp-26)10.56 K94.70 μs±126.50%79.80 μs79.35 μs, 79.36 μs75.70 μs64483.82 μs420519
tail +order (1.13.4-otp-24)10.20 K98.01 μs±236.80%84.80 μs81.91 μs79.22 μs123986.92 μs405920
tail (1.13.4-otp-24)10.17 K98.37 μs±70.24%85.55 μs82.62 μs81.05 μs41801.49 μs404374
body (1.16.0-otp-26)8.61 K116.19 μs±18.37%118.16 μs86.39 μs83.71 μs5156.24 μs343072
body (1.13.4-otp-24)7.60 K131.50 μs±13.94%129.71 μs125.90 μs, 125.72 μs, 125.91 μs106.46 μs5935.86 μs302924
tail +order (1.13.4-otp-23)7.34 K136.32 μs±232.24%120.61 μs109.26 μs106.66 μs168040.73 μs292044
body (1.13.4-otp-23)6.51 K153.55 μs±9.75%153.70 μs147.51 μs139.84 μs5164.72 μs259470
tail +order (1.6.6-otp-21)6.36 K157.14 μs±175.28%142.99 μs138.40 μs122.31 μs101605.07 μs253459
tail (1.13.4-otp-23)6.25 K159.92 μs±116.12%154.20 μs125.40 μs115.74 μs47040.19 μs249144
body (1.6.6-otp-21)6.23 K160.49 μs±9.88%159.88 μs159.82 μs109.67 μs4938.61 μs248259
tail (1.6.6-otp-21)5.83 K171.54 μs±71.94%158.44 μs157.72 μs121.83 μs40861.21 μs232243

You can see the standard deviation here can be quite high, which is “thanks” to a few outliers that make the boxplot almost unreadable. Noise from Garbage Collection is often a bit of a problem with micro-benchmarks, but the results are stable and the sample size big enough. Here is a highly zoomed in boxplot to make it readable:

What’s really impressive to me is that the fastest version is 57% faster than the fastest non JIT version (tail +order (1.16.0-otp-26) vs. tail +order (1.13.4-otp-23)). Of course, this is a very specific benchmark and may not be indicative of overall performance gains – it’s impressive nonetheless. The other good sign is that we seem to be continuing to improve, as our current best version is 13% faster than anything available on our other most recent platform (1.13 @ OTP 24.3).

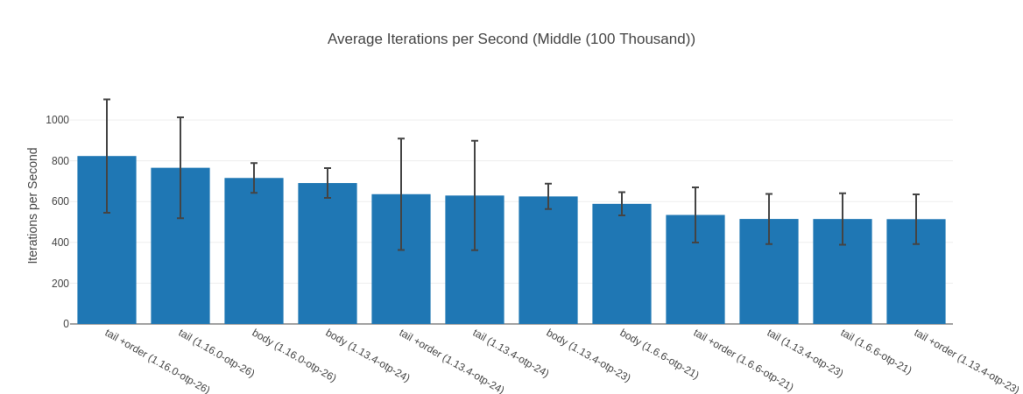
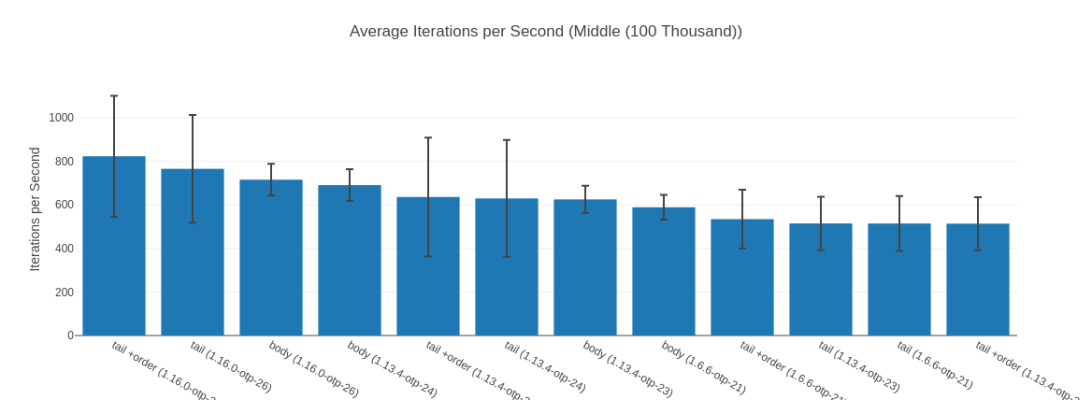
The performance uplift of Elixir 1.16 running on OTP 26.2 is even more impressive when we look at the input list of 100k elements – where all its map implementations take the 3 top spots:
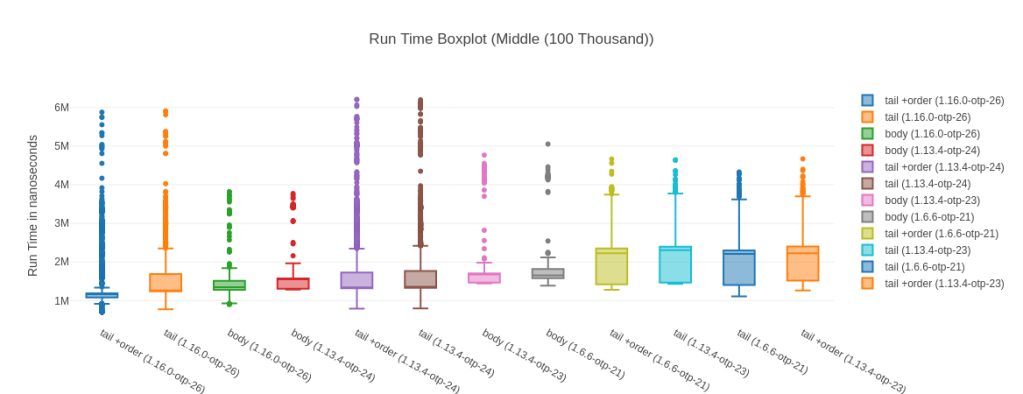
Table with more detailed data
NameIterations per SecondAverageDeviationMedianModeMinimumMaximumSample size
tail +order (1.16.0-otp-26)823.461.21 ms±33.74%1.17 ms0.71 ms0.70 ms5.88 ms32921
tail (1.16.0-otp-26)765.871.31 ms±32.35%1.25 ms0.78 ms0.77 ms5.91 ms30619
body (1.16.0-otp-26)715.861.40 ms±10.19%1.35 ms1.51 ms, 1.28 ms0.90 ms3.82 ms28623
body (1.13.4-otp-24)690.921.45 ms±10.57%1.56 ms1.30 ms, 1.31 ms1.29 ms3.77 ms27623
tail +order (1.13.4-otp-24)636.451.57 ms±42.91%1.33 ms1.32 ms, 1.32 ms, 1.32 ms, 1.32 ms, 1.32 ms, 1.32 ms0.79 ms6.21 ms25444
tail (1.13.4-otp-24)629.781.59 ms±42.61%1.36 ms1.36 ms0.80 ms6.20 ms25178
body (1.13.4-otp-23)625.421.60 ms±9.95%1.68 ms1.45 ms, 1.45 ms1.44 ms4.77 ms25004
body (1.6.6-otp-21)589.101.70 ms±9.69%1.65 ms1.64 ms1.39 ms5.06 ms23553
tail +order (1.6.6-otp-21)534.561.87 ms±25.30%2.22 ms1.42 ms1.28 ms4.67 ms21373
tail (1.13.4-otp-23)514.881.94 ms±23.90%2.31 ms1.44 ms, 1.44 ms1.43 ms4.65 ms20586
tail (1.6.6-otp-21)514.641.94 ms±24.51%2.21 ms1.40 ms1.11 ms4.33 ms20577
tail +order (1.13.4-otp-23)513.891.95 ms±23.73%2.23 ms1.52 ms1.26 ms4.67 ms20547

Here the speedup of “fastest JIT vs. fastest non JIT” is still a great 40%. Interestingly here though, for all versions except for Elixir 1.16.0 on OTP 26.2 the body-recursive functions are faster than their tail-recursive counter parts. Hold that thought for later, let’s first take a look a weird outlier – the input list with 1 Million elements.

The Outlier Input – 1 Million

So, why is that the outlier? Well, here Elixir 1.13 on OTP 24.3 is faster than Elixir 1.16 on OTP 26.2! Maybe we just got unlucky you may think, but I have reproduced this result over many different runs of this benchmark. The lead also goes away again with an input list of 10 Million. Now, you may say “Tobi, we shouldn’t be dealing with lists of 1 Million and up elements anyhow” and I’d agree with you. Humor me though, as I find it fascinating what a huge impact inputs can have as well as how “random” they are. At 100k and 10 Million our Elixir 1.16 is fastest, but somehow for 1 Million it isn’t? I have no idea why, but it seems legit.
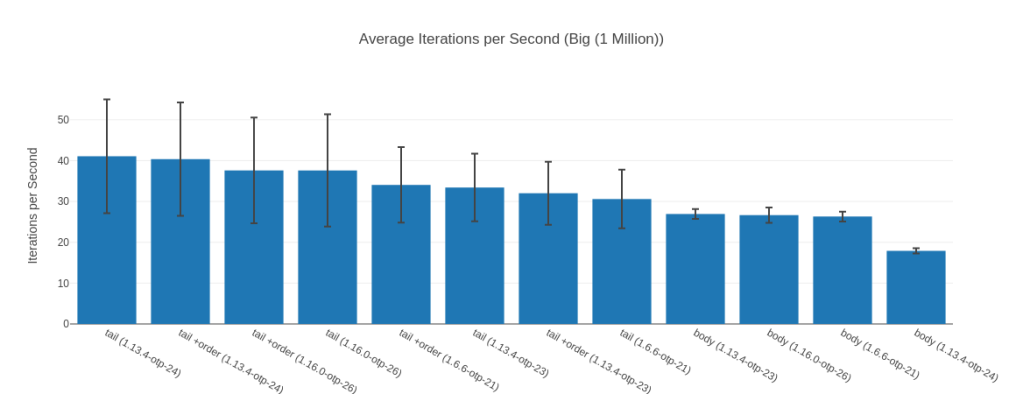
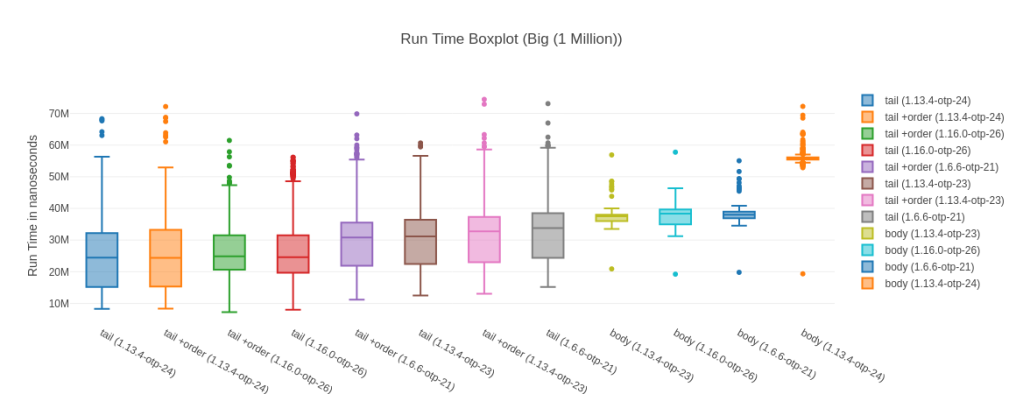
Table with more data
NameIterations per SecondAverageDeviationMedianModeMinimumMaximumSample size
tail (1.13.4-otp-24)41.0724.35 ms±33.92%24.44 msnone8.31 ms68.32 ms1643
tail +order (1.13.4-otp-24)40.3724.77 ms±34.43%24.40 ms33.33 ms, 15.15 ms8.36 ms72.16 ms1615
tail +order (1.16.0-otp-26)37.6026.60 ms±34.40%24.86 ms26.92 ms7.25 ms61.46 ms1504
tail (1.16.0-otp-26)37.5926.60 ms±36.56%24.57 msnone8.04 ms56.17 ms1503
tail +order (1.6.6-otp-21)34.0529.37 ms±27.14%30.79 ms37.39 ms11.20 ms69.86 ms1362
tail (1.13.4-otp-23)33.4129.93 ms±24.80%31.17 msnone12.47 ms60.67 ms1336
tail +order (1.13.4-otp-23)32.0131.24 ms±24.13%32.78 ms23.27 ms13.06 ms74.43 ms1280
tail (1.6.6-otp-21)30.5932.69 ms±23.49%33.78 msnone15.17 ms73.09 ms1224
body (1.13.4-otp-23)26.9337.13 ms±4.54%37.51 ms38.11 ms20.90 ms56.89 ms1077
body (1.16.0-otp-26)26.6537.52 ms±7.09%38.36 msnone19.23 ms57.76 ms1066
body (1.6.6-otp-21)26.3238.00 ms±4.56%38.02 msnone19.81 ms55.04 ms1052
body (1.13.4-otp-24)17.9055.86 ms±3.63%55.74 msnone19.36 ms72.21 ms716

Before we dig in, it’s interesting to notice that at the 1 Million inputs mark, the body-recursive functions together occupy the last 4 spots of our ranking. It stays like this for all bigger inputs.

When I look at a result that is “weird” to me I usually look at a bunch of other statistical values: 99th%, median, standard deviation, maximum etc. to see if maybe there were some weird outliers here. Specifically I’m checking whether the medians roughly line up with the averages in their ordering – which they do here. Everything seems fine here.

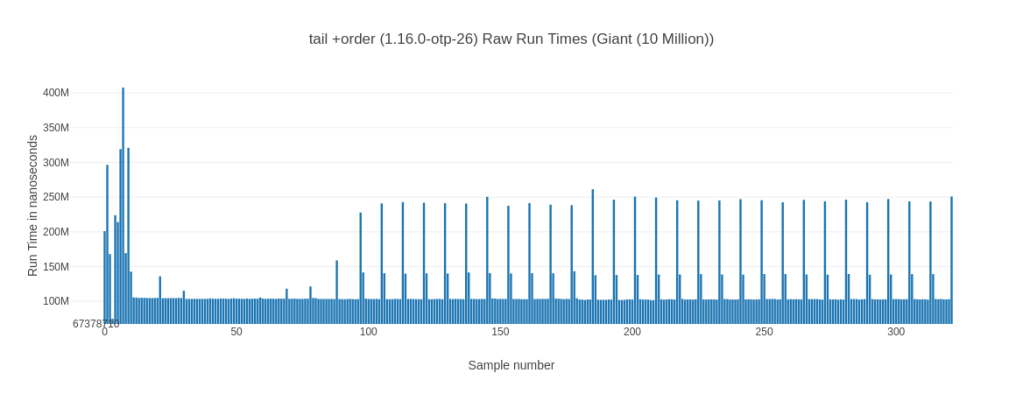
The next thing I’m looking are the raw recorded run times (in order) as well as their general distribution. While looking at those you can notice some interesting behavior. While both elixir 1.13 @ OTP 24.3 solutions have a more or less steady pattern to their run times, their elixir 1.16 @ OTP 26.2 counter parts seem to experience a noticeable slow down towards the last ~15% of their measurement time. Let’s look at 2 examples for the the tail +order variants:
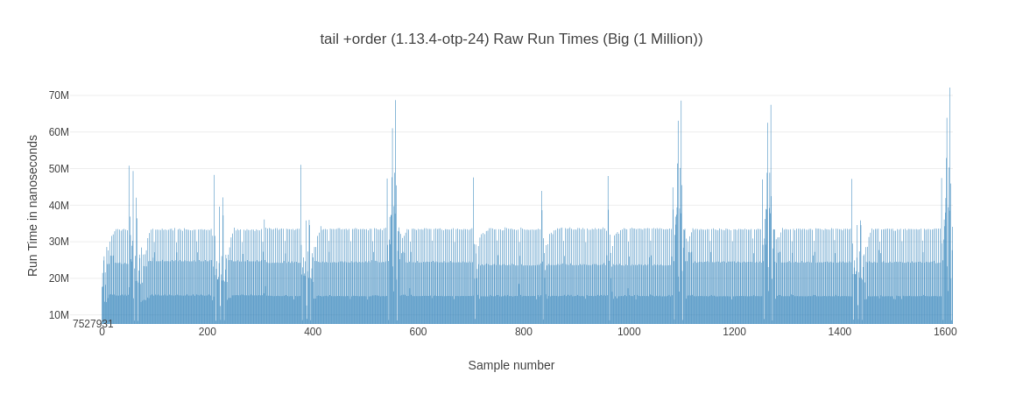
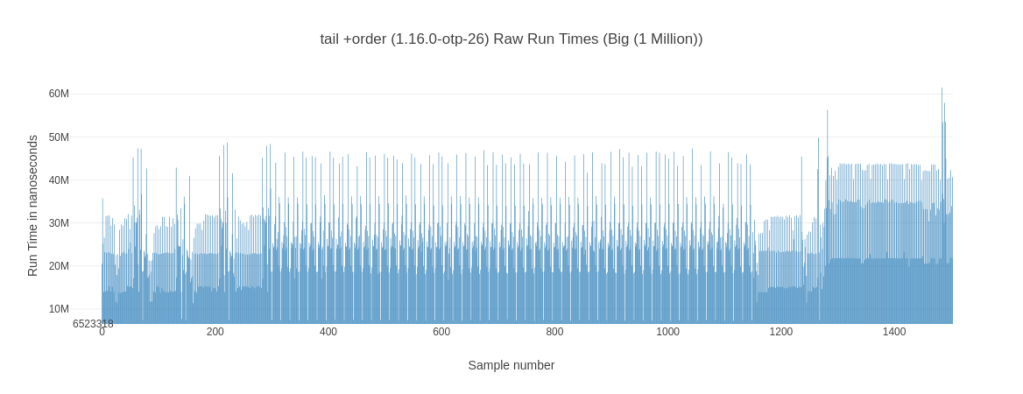
Why is this happening? I don’t know – you could blame it on on some background job or something kicking in but then it wouldn’t be consistent across tail and tail +order for the elixir 1.16 variant. While we’re looking at these graphs, what about the bod-recursive cousin?

Less Deviation for Body-Recursive Functions
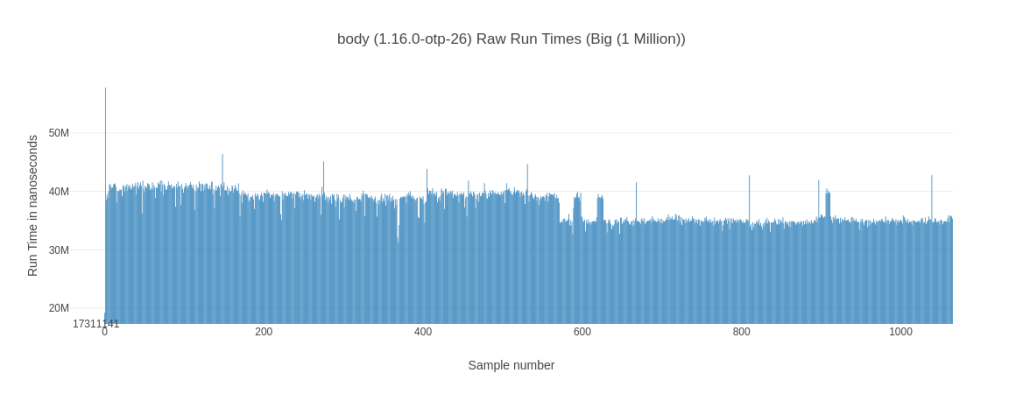
The body-recursive version looks a lot smoother and less jittery. This is something you can observe across all inputs – as indicated by the much lower standard-deviation of body-recursive implementations.

Memory Consumption

The memory consumption story is much less interesting – body-recursive functions consume less memory and by quite the margin! ~50% of the tail-recursive functions for all but our smallest input size – there it’s still 70%.

This might also be one of the key to seeing less jittery run times – less memory means less garbage produced means fewer garbage collection runs necessary.

A 60%+ lead – the 10 Million Input

What I found interesting looking at the results is that for our 10 Million input elixir 1.16 @ OTP 26 is 67% faster than the next fastest implementation. Which is a huge difference.
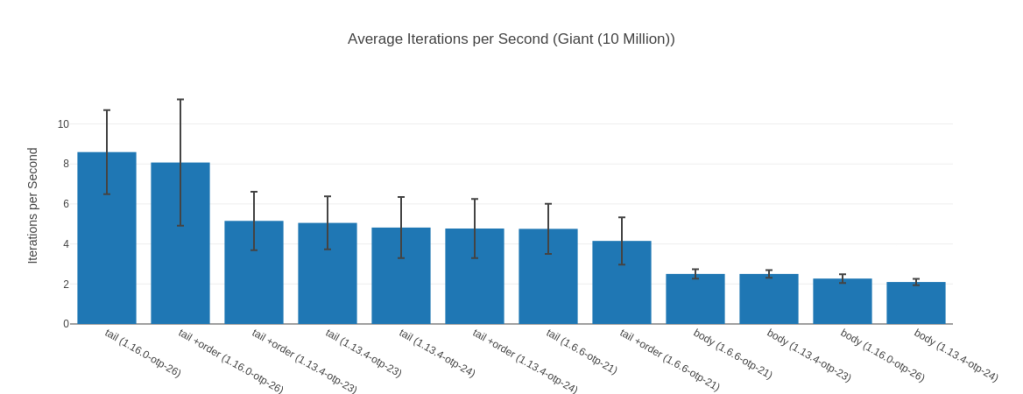
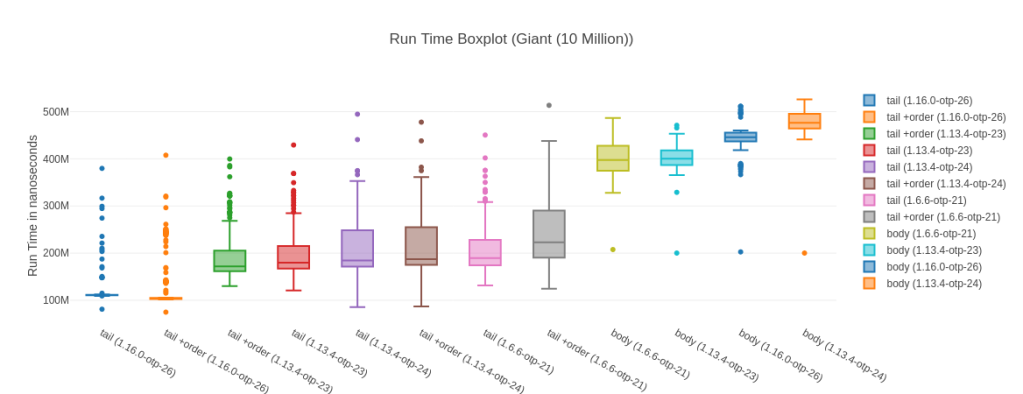
Table with more data
NameIterations per SecondAverageDeviationMedianModeMinimumMaximumSample size
tail (1.16.0-otp-26)8.59116.36 ms±24.44%111.06 msnone81.09 ms379.73 ms343
tail +order (1.16.0-otp-26)8.07123.89 ms±39.11%103.42 msnone74.87 ms407.68 ms322
tail +order (1.13.4-otp-23)5.15194.07 ms±28.32%171.83 msnone129.96 ms399.67 ms206
tail (1.13.4-otp-23)5.05197.91 ms±26.21%179.95 msnone120.60 ms429.31 ms203
tail (1.13.4-otp-24)4.82207.47 ms±31.62%184.35 msnone85.42 ms494.75 ms193
tail +order (1.13.4-otp-24)4.77209.59 ms±31.01%187.04 msnone86.99 ms477.82 ms191
tail (1.6.6-otp-21)4.76210.30 ms±26.31%189.71 ms224.04 ms131.60 ms450.47 ms190
tail +order (1.6.6-otp-21)4.15240.89 ms±28.46%222.87 msnone124.69 ms513.50 ms166
body (1.6.6-otp-21)2.50399.78 ms±9.42%397.69 msnone207.61 ms486.65 ms100
body (1.13.4-otp-23)2.50399.88 ms±7.58%400.23 msnone200.16 ms471.13 ms100
body (1.16.0-otp-26)2.27440.73 ms±9.60%445.77 msnone202.63 ms511.66 ms91
body (1.13.4-otp-24)2.10476.77 ms±7.72%476.57 msnone200.17 ms526.09 ms84

We also see that the tail-recursive solution here is almost 4 times as fast as the body-recursive version. Somewhat interestingly the version without the argument order switch seems faster here (but not by much). You can also see that the median is (considerably) in favor of tail +order against its just tail counter part.

Let’s take another look at our new found friend – the raw run times chart:
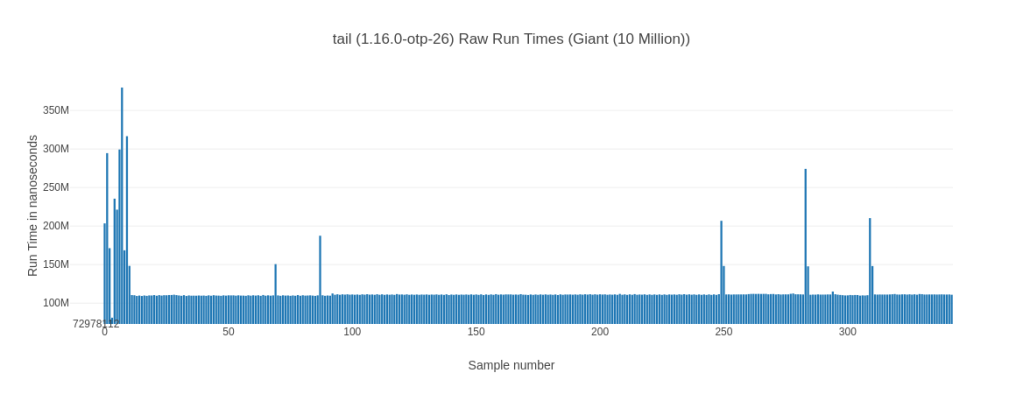
We can clearly see that the tail +order version goes into a repeating pattern of taking much longer every couple of runs while the tail version is (mostly) stable. That explains the lower average while it has a higher median for the tail version. It is faster on average by being more consistent – so while its median is slightly worse it is on average faster as it doesn’t exhibit these spikes. Why is this happening? I don’t know, except that I know I’ve seen it more than once.

The body-recursive to tail-recursive reversal

As you may remember from the intro, this journey once began with “Tail Call Optimization in Elixir & Erlang – not as efficient and important as you probably think” – claiming that body-recursive version was faster than the tail-recursive version. The last revision showed some difference in what function was faster based on what input was used.

And now? For Elixir 1.16 on OTP 26.2 the tail-recursive functions are faster than their body-recursive counter part on all tested inputs! How different depends on the input size – from just 15% to almost 400% we’ve seen it all.

This is also a “fairly recent” development – for instance for our 100k input for Elixir 1.13@OTP 24 the body-recursive function is the fastest.

Naturally that still doesn’t mean everything should be tail-recursive: This is one benchmark with list sizes you may rarely see. Memory consumption and variance are also points to consider. Also let’s remember a quote from “The Seven Myths of Erlang Performance” about this:

It is generally not possible to predict whether the tail-recursive or the body-recursive version will be faster. Therefore, use the version that makes your code cleaner (hint: it is usually the body-recursive version).

And of course, some use cases absolutely need a tail-recursive function (such as Genservers).

Finishing Up

So, what have we discovered? On our newest Elixir and Erlang versions tail-recursive functions shine more than they did before – outperforming the competition. We have seen some impressive performance improvements over time, presumably thanks to the JIT – and we seem to be getting even more performance improvements.

As always, run your own benchmarks – don’t trust some old post on the Internet saying one thing is faster than another. Your compiler, your run time – things may have changed.

Lastly, I’m happy to finally publish these results – it’s been a bit of a yak shave. But, a fun one! 😁
Careful what data you send or how to tank your performance with Task.async

In Elixir and on the BEAM (Erlang Virtual Machine) in general we love our processes – lightweight, easily run millions of them, easy lock-less parallelism – you’ve probably heard it all. Processes are great and one of the many reasons people gravitate towards the BEAM.

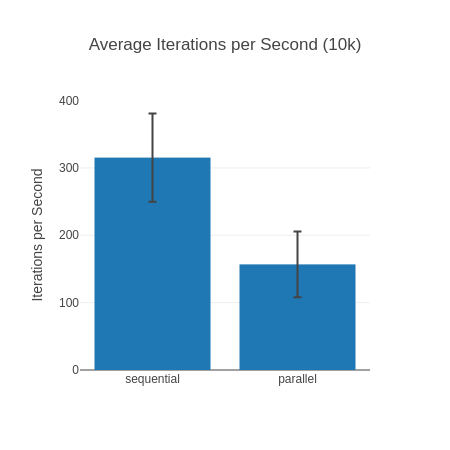
Functions like Task.async/1 make parallelism effortless and can feel almost magical. Cool, let’s use it in a simple benchmark! Let’s create some random lists, and then let’s run some non trivial Enum functions on them: uniq, frequencies and shuffle and let’s compare doing them sequentially (one after the other) and running them all in parallel. This kind of work is super easy to parallelize, so we can just fire off the tasks and then await them:

random_list = fn size, spread ->
for _i <- 1..size, do: :rand.uniform(spread)
end
inputs = [
{"10k", random_list.(10_000, 100)},
{"1M", random_list.(1_000_000, 1_000)},
{"10M", random_list.(10_000_000, 10_000)}
]
Benchee.run(
%{
"sequential" => fn big_list ->
uniques = Enum.uniq(big_list)
frequencies = Enum.frequencies(big_list)
shuffled = Enum.shuffle(big_list)
[uniques, frequencies, shuffled]
end,
"parallel" => fn big_list ->
tasks = [
Task.async(fn -> Enum.uniq(big_list) end),
Task.async(fn -> Enum.frequencies(big_list) end),
Task.async(fn -> Enum.shuffle(big_list) end)
]
Task.await_many(tasks, :infinity)
end
},
inputs: inputs,
warmup: 15,
time: 60,
formatters: [
{Benchee.Formatters.Console, extended_statistics: true},
{Benchee.Formatters.HTML, file: "bench/output/task_no_task/index.html", auto_open: false}
]
)
view raw benchmark.exs hosted with ❤ by GitHub

Cool, let’s check out the results! You can check the HTML report online here, uncollapse for the console formatter version or just check out the pictures.

Console formatter output
Operating System: Linux
CPU Information: AMD Ryzen 9 5900X 12-Core Processor
Number of Available Cores: 24
Available memory: 31.25 GB
Elixir 1.16.0-rc.1
Erlang 26.1.2
JIT enabled: true

Benchmark suite executing with the following configuration:
warmup: 15 s
time: 1 min
memory time: 0 ns
reduction time: 0 ns
parallel: 1
inputs: 10k, 1M, 10M
Estimated total run time: 7.50 min

##### With input 10k #####
Name                 ips        average  deviation         median         99th %
sequential        315.29        3.17 ms    ±20.76%        2.96 ms        5.44 ms
parallel          156.77        6.38 ms    ±31.08%        6.11 ms       10.75 ms

Comparison: 
sequential        315.29
parallel          156.77 - 2.01x slower +3.21 ms

Extended statistics: 

Name               minimum        maximum    sample size                     mode
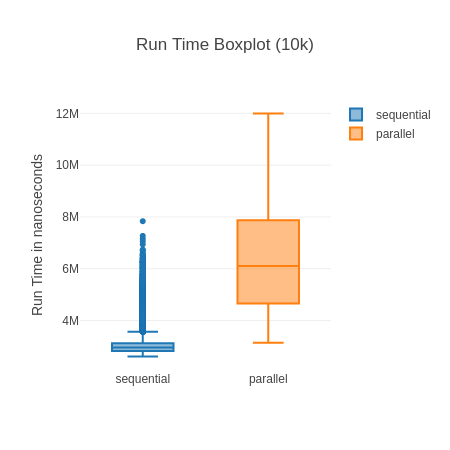
sequential         2.61 ms        7.84 ms        18.91 K         2.73 ms, 3.01 ms
parallel           3.14 ms       11.99 ms         9.40 K4.80 ms, 4.87 ms, 8.93 ms

##### With input 1M #####
Name                 ips        average  deviation         median         99th %
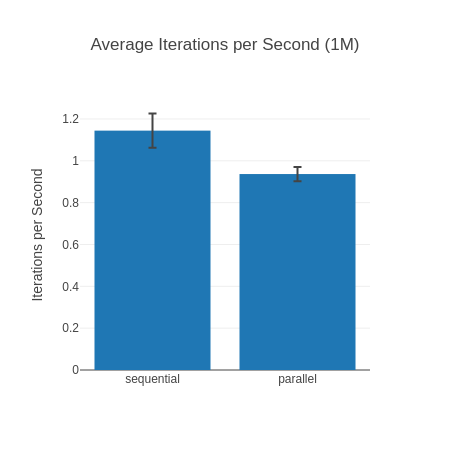
sequential          1.14         0.87 s     ±7.16%         0.88 s         0.99 s
parallel            0.94         1.07 s     ±3.65%         1.07 s         1.16 s

Comparison: 
sequential          1.14
parallel            0.94 - 1.22x slower +0.194 s

Extended statistics: 

Name               minimum        maximum    sample size                     mode
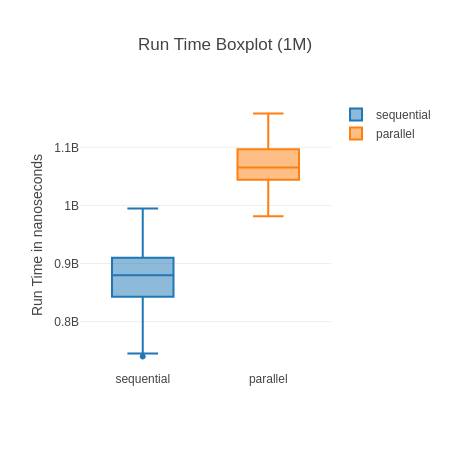
sequential          0.74 s         0.99 s             69                     None
parallel            0.98 s         1.16 s             57                     None

##### With input 10M #####
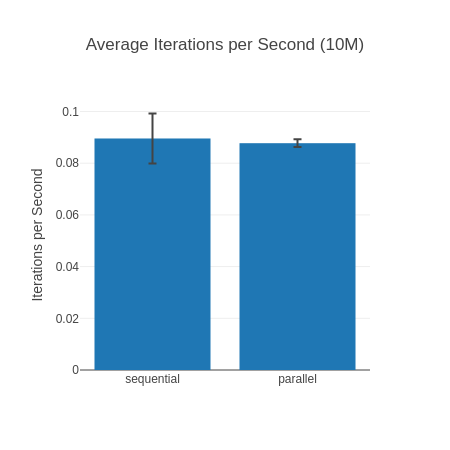
Name                 ips        average  deviation         median         99th %
sequential        0.0896        11.17 s    ±10.79%        11.21 s        12.93 s
parallel          0.0877        11.40 s     ±1.70%        11.37 s        11.66 s

Comparison: 
sequential        0.0896
parallel          0.0877 - 1.02x slower +0.23 s

Extended statistics: 

Name               minimum        maximum    sample size                     mode
sequential          9.22 s        12.93 s              6                     None
parallel           11.16 s        11.66 s              6                     None
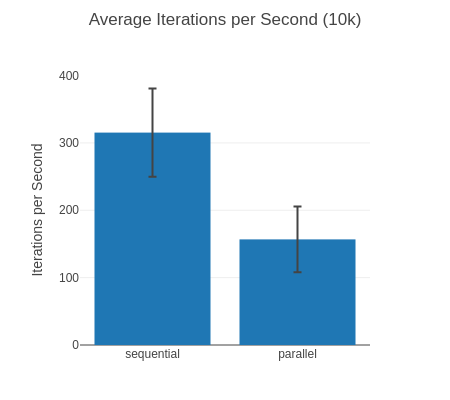
10k input, iterations per second (higher is better)
Boxplot for 10k, measured run time (lower is better). Sort of interesting how many “outliers” (blue dots) there are for sequential though.
1M input, iterations per second (higher is better)
Boxplot for 1M, measured run time (lower is better).
10M input, iterations per second (higher is better). Important to know, they take so long here the sample size is only 6 for each.

And just as we all expected the parallel… no wait a second the sequential version is faster for all of them? How could that be? This was easily parallelizable work, split into 3 work packages with many more cores available to do the work. Why is the parallel execution slower?

What happened here?

There’s no weird trick to this: It ran on a system with 12 physical cores that was idling save for the benchmark. Starting processes is extremely fast and lightweight, so that’s also not it. By most accounts, parallel processing should win out.

What is the problem then?

The problem here are the huge lists the tasks need to operate on and the return values that need to get back to the main process. The BEAM works on a “share nothing” architecture, this means in order to process theses lists in parallel we have to copy the lists over entirely to the process (Tasks are backed by processes). And once they’re done, we need to copy over the result as well. Copying, esp. big data structures, is both CPU intensive and memory intensive. In this case the additional copying work we do outweighs the gains we get by processing the data in parallel. You can also see that this effect seems to be diminishing the bigger the lists get – so it seems like the parallelization is catching up there.

The full copy may sound strange – after all we’re dealing with immutable data structures which should be safe to share. Well, once processes share data garbage collection becomes a whole other world of complex, or in the words of the OTP team in “A few notes on message passing” (emphasis mine):

Sending a message is straightforward: we try to find the process associated with the process identifier, and if one exists we insert the message into its signal queue.

Messages are always copied before being inserted into the queue. As wasteful as this may sound it greatly reduces garbage collection (GC) latency as the GC never has to look beyond a single process. Non-copying implementations have been tried in the past, but they turned out to be a bad fit as low latency is more important than sheer throughput for the kind of soft-realtime systems that Erlang is designed to build.

John Högberg

Robert Virding (co-inventor of Erlang) also puts some more color to it in a thread on elixir forum.

In case you’re interested in other factors for this particular benchmark: I chose the 3 functions semi-randomly looking for functions that traverse the full list at least once doing some non trivial work. If you do heavier work on the lists the parallel solution will fare better. We can also not completely discount that CPU boosting (where single core performance may increase if the other cores are idle) is shifting benchmark a bit in favor of sequential but overall it should be solid enough for demonstration purposes. Due to the low sample size for the 10M list, parallel execution may sometimes come out ahead, but usually doesn’t (and I didn’t want the benchmark take even longer).

The Sneakyness

Now, the problem here is a bit more sneaky – as we’re not explicitly sending messages. Our code looks like this: Task.async(fn -> Enum.uniq(big_list) end) – there is no send or GenServer.call here! However, that function still needs to make its way to the process for execution. As the closure of the function automatically captures referenced variables – all that data ends up being copied over as well! (Technically speaking Task.async does a send under the hood, but spawn/1 also behaves like this.)

This is what caught me off-guard with this – I knew messages were copied, but somehow Task.async was so magical I didn’t think about it sending messages or needing to copy its data to a process. Let’s call it a blind spot and broken mental model I’ve had for way too long. Hence, this blog post is for you dear reader – may you avoid the mistake I made!

Let’s also be clear here that normally this isn’t a problem and the benefits we get from this behavior are worth it. When a process terminates we can just free all its memory. It’s also not super common to shift so much data to a process to do comparatively lightweight work. The problem here is a bit, how easy it is for this problem to sneak up on you when using these high level abstractions like Task.async/1.

Real library, real problems

Yup. While I feel some shame about it, I’ve always been an advocate for sharing mistakes you made to spread some of the best leanings. This isn’t a purely theoretical thing I ran into – it stems from real problems I encountered. As you may know I’m the author of benchee – the best benchmarking library ™ 😉 . Benchee’s design, in a nut shell, revolves around a big data structure – the suite – data is enriched throughout the process of benchmarking. You may get a better idea by looking at the breakdown of the steps. This has worked great for us.

However, some of the data in that suite may reference large chunks of data if the benchmark operates on large data. Each Scenario references its given input as well as its benchmarking function. Given what we just learned both of these may be huge. More than that, the Configuration also holds all the configured inputs and is part of the suite as well.

Now, when benchee tries to compute your statistics in parallel it happily creates a new process for each scenario (which may be 20+) copying over the benchmarking function and input although it really doesn’t need them.

Even worse formatters are run in parallel handing over the entire suite – including all scenarios (function and input) as well as all the inputs again as part of the Configuration – none of which a formatter should need. 😱

To be clear, you will only encounter this problem if you deal with huge sets of data and if you do it’s “just” more memory and time used. However, for a library about measuring things and making them fast this is no good.

The remedy

Thankfully, there are multiple possible remedies for this problem:

  • Limiting the data you send to the absolute necessary minimum, instead of just sending the whole struct. For example, don’t send an entire Suite struct if all you need is a couple of fields.
  • If only the process needs the data, it may fetch the data itself instead. I.e. instead of putting the result of a giant query into the process, the process could be the one doing the query if it’s the only one that needs the data.
  • There are some data structures that are shared between processes and hence don’t need copying, such as ets and persistent_term.

As teased above, the most common and easiest solution is just to pass along the data you need, if you ended up accidentally sending along more than you wanted to. You can see one step of it in this pull request or this one.

The results are quite astounding, for a benchmark I’m working on (blog post coming soon ™) this change got it from practically being unable to run the benchmark due to memory constraints (on a 32GB RAM system) to easily running the benchmark – maximum resident size set size got almost halfed.

The magnitude of this can also be shown perhaps by the size of the files I saved for this benchmark. Saving is actually implemented as a formatter, and so automatically benefits from these changes – the file size for this benchmark went down from ~200MB per file to 1MB aka a reduction to 0.5% in size. You can read more about how it improved in the benchee 1.3.0 release notes.

Naturally this change will also make its way to you all as benchee 1.3.0 soon (edit: out now!).

Also when pursuing to fix this be mindful that you need to completely remove the variable from the closure. You can’t just go: Task.async(fn -> magic(suite.configuration) end) – the entire suite will still be sent along.

iex(1)> list = Enum.to_list(1..100_000)
iex(2)> # do not benchmark in iex, this is purely done to get a suite with some data
iex(3)> suite = Benchee.run(%{map: fn -> Enum.map(list, fn i -> i * i end) end })
iex(4)> :erts_debug.size(suite)
200642
iex(5)> :erts_debug.size(fn -> suite end)
200675
iex(6)> :erts_debug.size(fn -> suite.configuration end)
200841
iex(7)> :erts_debug.size(fn -> suite.configuration.time end)
201007
iex(8)> configuration = suite.configuration
iex(9)> :erts_debug.size(fn -> configuration.time end)
295
iex(10)> time = configuration.time
iex(11)> :erts_debug.size(fn -> time end)
54

Helping others avoid making the same mistake

All of that discovery, and partially shame, left me with the question: How can I help others avoid making the same mistake? Well, one part of it is right here – publish a blog post. However, that’s one point.

We already added documentation to the Task module mentioning this, and as proposed by José are working on adding a section to the process anti-patterns section.

Also don’t forget: processes are still awesome and lightweight – you should use them! This is just a cautionary tale of how things might go wrong if you’re dealing with big chunks of data and that the work you’re doing on that data may not be extensive enough to warrant a full copy. Or that you’re accidentally sending along too much data unaware of the consequences. There are many more use cases for processes and tasks that are absolutely great, appropriate and will save you a ton of time.

What does this leave us with? As usual: don’t assume, always benchmark!

Also, be careful about the data you’re sending around and if you really need it! 💚

The great Rubykon Benchmark 2020: CRuby vs JRuby vs TruffleRuby

It has been far too long, more than 3.5 years since the last edition of this benchmark. Well what to say? I almost had a new edition ready a year ago and then the job hunt got too intense and now the heat wave in Berlin delayed me. You don’t want your computer running at max capacity for an extended period, trust me.

Well, you aren’t here to hear about why there hasn’t been a new edition in so long, you’re here to read about the new edition! Most likely you’re here to look at graphs and see what’s the fastest ruby implementation out there. And I swear we’ll get to it but there’s some context to establish first. Of course, feel free to skip ahead if you just want the numbers.

Well, let’s do this!

What are we benchmarking?

We’re benchmarking Rubykon again, a Go AI written in Ruby using Monte Carlo Tree Search. It’s a fun project I wrote a couple of years back. Basically it does random playouts of Go games and sees what moves lead to a winning game building a tree with different game states and their win percentages to select the best move.

Why is this a good problem to benchmark? Performance matters. The more playouts we can do the better our AI plays because we have more data for our decisions. The benchmark we’re running starts its search from an empty 19×19 board (biggest “normal” board) and does 1000 full random playouts from there. We’ll measure how long that takes/how often we could do that in a minute. This also isn’t a micro benchmark, while remaining reasonable in size it looks at lots of different methods and access patterns.

Why is this a bad problem to benchmark? Most Ruby devs are probably interested in some kind of web application performance. This does no IO (which keeps the focus on ruby code execution, which is also good) and mainly deals with arrays. While we deal with collections all the time, rubykon also accesses a lot of array indexes all over, which isn’t really that common. It also barely deals with strings. Moreover, it does a whole lot of (pseudo-)random number generation which definitely isn’t a common occurrence. It also runs a relatively tight hot loop of “generate random valid move, play it, repeat until game over”, which should be friendly to JIT approaches.

What I want to say, this is an interesting problem to benchmark but it’s probably not representative of web application performance of the different ruby implementations. It is still a good indicator of where different ruby implementations rank performance wise.

It’s also important to note that this benchmark is single threaded – while it is a problem suited for parallelization I haven’t done so yet. Plus, single threaded applications are still typical for Ruby (due to the global interpreter lock in CRuby).

We’re also mainly interested in “warm” application performance i.e. giving them a bit of time to warm up and look at their peak performance. We’ll also look at the warmup times in a separate section though.

The competitors

Our competitors are ruby variants I could easily install on my machine and was interested in which brings us to:

  • CRuby 2.4.10
  • CRuby 2.5.8
  • CRuby 2.6.6
  • CRuby 2.7.1
  • CRuby 2.8.0-dev (b4b702dd4f from 2020-08-07) (this might end up being called Ruby 3 not 2.8)
  • truffleruby-1.0.0-rc16
  • truffleruby-20.1.0
  • jruby-9.1.17.0
  • jruby-9.2.11.1

All of those versions were current as of early August 2020. As usual doing all the benchmarking, graphing and writing has taken me some time so that truffleruby released a new version in the mean time, result shouldn’t differ much though.

CRuby (yes I still insist on calling it that vs. MRI) is mainly our base line as it’s the standard ruby interpreter. Versions that are capable of JITing (2.6+) will also be run with the –jit flag separately to show improvement (also referred to as MJIT).

TruffleRuby was our winner the last 2 times around. We’re running 20.1 and 1.0-rc16 (please don’t ask me why this specific version, it was in the matrix from when I originally redid this benchmarks a year ago). We’re also going to run both native and JVM mode for 20.1.

JRuby will be run “normally”, and with invokedynamic + server flag (denoted by “+ID”). We’re also gonna take a look at JDK 8 and JDK 14. For JDK 14 we’re also going to run it with a non default GC algorithm, falling back to the one used in JDK 8 as the new default is slower for this benchmark. Originally I also wanted to run with lots of different JVMs but as it stands I already recorded almost 40 different runs in total and the JVMs I tried didn’t show great differences so we’ll stick with the top performer of those I tried which is AdoptOpenJDK.

You can check all flags passed etc. in the benchmark script.

The Execution Environment

This is still running on the same Desktop PC that I did the first version of these benchmarks with – almost 5 years ago. In the meantime it was hit by a lot of those lovely intel security vulnerabilities though. It’s by no means a top machine any more.

The machine has 16 GB of RAM, runs Linux Mint 19.3 (based on Ubuntu 18.04 LTS) and most importantly an i7-4790 (3.6 GHz, 4 GHz boost) (which is more than 6 years old now).

tobi@speedy:~$ uname -a
Linux speedy 5.4.0-42-generic #46~18.04.1-Ubuntu SMP Fri Jul 10 07:21:24 UTC 2020 x86_64 x86_64 x86_64 GNU/Linux
tobi@speedy:~$ lscpu
Architecture: x86_64
CPU op-mode(s): 32-bit, 64-bit
Byte Order: Little Endian
CPU(s): 8
On-line CPU(s) list: 0-7
Thread(s) per core: 2
Core(s) per socket: 4
Socket(s): 1
NUMA node(s): 1
Vendor ID: GenuineIntel
CPU family: 6
Model: 60
Model name: Intel(R) Core(TM) i7-4790 CPU @ 3.60GHz
Stepping: 3
CPU MHz: 3568.176
CPU max MHz: 4000,0000
CPU min MHz: 800,0000
BogoMIPS: 7200.47
Virtualization: VT-x
L1d cache: 32K
L1i cache: 32K
L2 cache: 256K
L3 cache: 8192K
NUMA node0 CPU(s): 0-7
Flags: fpu vme de pse tsc msr pae mce cx8 apic sep mtrr pge mca cmov pat pse36 clflush dts acpi mmx fxsr sse sse2 ss ht tm pbe syscall nx pdpe1gb rdtscp lm constant_tsc arch_perfmon pebs bts rep_good nopl xtopology nonstop_tsc cpuid aperfmperf pni pclmulqdq dtes64 monitor ds_cpl vmx smx est tm2 ssse3 sdbg fma cx16 xtpr pdcm pcid sse4_1 sse4_2 x2apic movbe popcnt tsc_deadline_timer aes xsave avx f16c rdrand lahf_lm abm cpuid_fault epb invpcid_single pti ssbd ibrs ibpb stibp tpr_shadow vnmi flexpriority ept vpid ept_ad fsgsbase tsc_adjust bmi1 avx2 smep bmi2 erms invpcid xsaveopt dtherm ida arat pln pts md_clear flush_l1d
view raw system_info hosted with ❤ by GitHub

All background applications were closed and while the benchmarks were running no GUI was active. They were run on hot Berlin evenings 😉

If you want to run these benchmarks yourself the rubykon repo has the instructions, with most of it being automated.

Timing wise I chose 5 minutes of warmup and 2 minutes of run time measurements. The (enormous) warmup time was mostly driven by behaviour observed in TruffleRuby where sometimes it would deoptimize even after a long warmup. So, I wanted to make sure everyone had all the time they needed to reach good “warm” performance.

Run Time Results

One more thing before we get to it: JRuby here ran on AdoptOpenJDK 8. Differences to AdoptOpenJDK 14 (and other JVMs) aren’t too big and would just clutter the graphs. We’ll take a brief look at them later.

If you want to take a look at all the data I gathered you can access the spreadsheet.

Iterations per Minute per Ruby implementation for running 1000 full playouts on a 19×19 board (higher is better).

Overall this looks more or less like the graphs from the last years:

  • CRuby is the baseline performance without any major jumps
  • JRuby with invokedynamic (+ID) gets a bit more than 2x the baseline performance of CRuby, invokedynamic itself makes it a lot faster (2x+)
  • TruffleRuby runs away with the win

What’s new though is the inclusion of the JIT option for CRuby which performs quite impressively and is only getting better. An 18% improvement on 2.6 goes up to 34% on 2.7 and tops out at 47% for 2.8 dev when looking at the JIT vs. non JIT run times of the same Ruby version. Looking at CRuby it’s also interesting that this time around “newer” CRuby performance is largely on par with not JITed JRuby performance.

The other thing that sticks out quite hugely are those big error bars on TruffleRuby 20. This is caused by some deoptimizations even after the long warmup. Portrayed here is a run where they weren’t as bad, even if they are worse performance was still top notch at 27 i/min overall though. It’s most likely a bug that these deoptimizations happen, you can check the corresponding issue. In the past the TruffleRuby always found a way to fix issues like this. So, the theoretical performance is a bit higher.

Another thing I like to look at is the relative speedup chart:

Speedup relative to CRuby 2.4.10 (baseline)

CRuby 2.4.10 was chosen as the “baseline” for this relative speedup chart mostly as a homage to Ruby 3×3 in which the goal was for Ruby 3 to be 3 times faster than Ruby 2.0. I can’t get Ruby < 2.4 to compile on my system easily any more and hence they are sadly missing here.

I’m pretty impressed with the JIT in Ruby 2.8: a speedup of over 60% is not to be scoffed at! So, as pointed out in the results above, I have ever rising hopes for it! JRuby (with invokedynamic) sits nice and comfortably at ~2.5x speedup which is a bit down from its 3x speedup in the older benchmarks. This might also be to the improved baseline of CRuby 2.4.10 versus the old CRuby 2.0 (check the old blog post for some numbers from then, not directly comparable though). TruffleRuby sits at the top thanks to the –jvm version with almost a 6x improvement. Perhaps more impressively it’s still 2.3 times faster than the fastest non TruffleRuby implementation. The difference between “native” and –jvm for TruffleRuby is also astounding and important to keep in mind should you do your own benchmarks.

What’s a bit baffling is that the performance trend for CRuby isn’t “always getting better” like I’m used to. The differences are rather small but looking at the small standard deviation (at most less than 1%) I’m rather sure of them. 2.5 is slower than 2.4, and 2.6 is faster than both 2.7 and 2.8.-dev. However, the “proper” order is established again when enabling the JIT.

If you’re rather interested in the data table you can still check out the spreadsheet for the full data, but here’s some of it inline:

Rubyi/minavg (s)stddev %relative speedup
2.4.105.6110.690.861
2.5.85.1611.630.270.919786096256684
2.6.66.619.080.421.17825311942959
2.6.6 –jit7.87.690.591.3903743315508
2.7.16.459.30.251.14973262032086
2.7.1 –jit8.646.950.291.54010695187166
2.8.0-dev6.289.560.321.11942959001783
2.8.0-dev –jit9.256.480.291.64884135472371
truffleruby-1.0.0-rc1616.553.632.192.95008912655971
truffleruby-20.1.020.222.9725.823.60427807486631
truffleruby-20.1.0 –jvm33.321.819.015.93939393939394
jruby-9.1.17.06.529.210.631.16221033868093
jruby-9.1.17.0 +ID14.274.20.292.54367201426025
jruby-9.2.11.16.339.490.541.1283422459893
jruby-9.2.11.1 +ID13.854.330.442.46880570409982

Warmup

Seems the JITing approaches are winning throughout, however such performance isn’t free. Conceptually, a JIT looks at what parts of your code are run often and then tries to further optimize (and often specialize) these parts of the code. This makes it a whole lot faster, this process takes time and work though.

The benchmarking numbers presented above completely ignore the startup and warmup time. The common argument for this is that in long lived applications (like most web applications) we spend the majority of time in the warmed up/hot state. It’s different when talking about scripts we run as a one off. I visualized and described the different times to measure way more in another post.

Anyhow, lets get a better feeling for those warmup times, shall we? One of my favourite methods for doing so is graphing the first couple of run times as recorded (those are all during the warmup phase):

Run times as recorded by iteration number for a few select Ruby implementations. Lower is faster/better.
Same data as above but as a line chart. Thanks to Stefan Marr for nudging me.

CRuby itself (without –jit) performs at a steady space, this is expected as no further optimizations are done and there’s also no cache or anything involved. Your first run is pretty much gonna be as fast as your last run. It’s impressive to see though that the –jit option is faster already in the first iteration and still getting better. What you can’t see in the graph, as it doesn’t contain enough run times and the difference is very small, is that the CRuby –jit option only reaches its peak performance around iteration 19 (going from ~6.7s to ~6.5s) which is quite surprising looking at how steady it seems before that.

TruffleRuby behaves in line with previous results. It has by far the longest warmup time, especially the JVM configuration which is in line with their presented pros and cons. The –jvm runtime configuration only becomes the fastest implementation by iteration 13! Then it’s faster by quite a bit though. It’s also noteworthy that for neither native nor JVM the time declines steadily. Sometimes subsequent iterations are slower which is likely due to the JIT trying hard to optimize something or having to deoptimize something. The random nature of Rubykon might play into this, as we might be hitting edge cases only at iteration 8 or so. While especially the first run time can be quite surprising, it’s noteworthy that during my years of doing these benchmarks I’ve seen TruffleRuby steadily improve its warmup time. As a datapoint, TruffleRuby 1.0.0-rc16 had its first 2 run times at 52 seconds and 25 seconds.

JRuby is very close to peak performance after one iteration already. Peak performance with invokedynamic is hit around iteration 7. It’s noteworthy that with invokedynamic even the first iteration is faster than CRuby “normal” and on par with the CRuby JIT implementation but in subsequent iterations gets much faster than them. The non invokedynamic version is very close to normal CRuby 2.8.0-dev performance almost the entire time, except for being slower in the first iteration.

For context it’s important to point out though that Rubykon is a relatively small application. Including the benchmarking library it’s not even 1200 lines of code long. It uses no external gems, it doesn’t even access the standard library. So all of the code is in these 1200 lines + the core Ruby classes (Array etc.) which is a far cry from a full blown Rails application. More code means more things to optimize and hence should lead to much longer warmup times than presented here.

JRuby/JVM musings

It might appear unfair that the results up there were run only with JDK 8. I can assure you, in my testing it sadly isn’t. I had hoped for some big performance jumps with the new JDK versions but I found no such thing. Indeed, it features the fastest version but only by a rather slim margin. It also requires switching up the GC algorithm as the new default performs worse at least for this benchmark.

Comparison JRuby with different options against AdoptOpenJDK 8 and 14

Performance is largely the same. JDK 14 is a bit faster when using both invokedynamic and falling back to the old garbage collector (+ParallelGC). Otherwise performance is worse. You can find out more in this issue. It’s curios though that JRuby 9.1 seems mostly faster than 9.2.

I got also quite excited at first looking at all the different new JVMs and thought I’d benchmark against them all, but it quickly became apparent that this was a typical case of “matrix explosion” and I really wanted for you all to also see these results unlike last year 😅 I gathered data for GraalVM and Java Standard Edition Reference Implementation in addition to AdoptOpenJDK but performance was largely the same and best at AdoptOpenJDK on my system for this benchmark. Again, these are in the spreadsheet.

I did one more try with OpenJ9 as it sounded promising. The results were so bad I didn’t even put them into the spreadsheet (~4 i/min without invokedynamic, ~1.5 i/min with invokedynamic). I can only imagine that either I’m missing a magic switch, OpenJ9 wasn’t built with a use case such as JRuby in mind or JRuby isn’t optimized to run on OpenJ9. Perhaps all of the above.

Final Thoughts

Alright, I hope this was interesting for y’all!

What did we learn? TruffleRuby still has the best “warm” performance by a mile, warmup is getting better but can still be tricky (–> unexpected slowdowns late into the process). The JIT for CRuby seems to get better continuously and has me a bit excited. CRuby performance has caught up to JRuby out of the box (without invokedynamic). JRuby with invokedynamic is still the second fastest Ruby implementation though.

It’s also interesting to see that every Ruby implementation has at least one switch (–jit, –jvm, invokedynamic) that significantly alters performance characteristics.

Please, also don’t forget the typical grain of salt: This is one benchmark, with one rather specific use case run on one machine. Results elsewhere might differ greatly.

What else is there? Promising to redo the benchmark next year would be something, but my experience tells me not to 😉

There’s an Enterprise version of GraalVM with supposedly good performance gains. Now, I won’t be spending money but you can evaluate it for free after registering. Well, if I ever manage to fix my Oracle login and get Oracle’s permission to publish the numbers I might (I’m fairly certain I can get that though 🙂 ). I also heard rumours of some CLI flags to try with TruffleRuby to get even better numbers 🤔

Finally, this benchmark has only looked at run times which is most often the most interesting value. However, there are other numbers that could prove interesting, such as memory consumption. These aren’t as easy to break down so neatly (or I don’t know how to). Showing the maximum amount of memory consumed during the measurement could be helpful though. As some people can tell you, with Ruby it can often be that you scale up your servers due to memory constraints not necessary CPU constraints.

I’d also be interested in how a new PC (planned purchase within a year!) affects these numbers.

So, there’s definitely some future work to be done here. Anything specific you want to see? Please let me know in the comments, via Twitter or however you like. Same goes for new graph types, mistakes I made or what not – I’m here to learn!

Benchee 0.14.0 – Micro Benchmarks? Pah, how about Nano Benchmarks!

Long time since the last benchee release, heh? Well, this one really packs a punch to compensate! It brings you a higher precision while measuring run times as well as a better way to specify formatter options. Let’s dive into the most notable changes here, the full list of changes can be found in the Changelog.

Of course, all formatters are also released in compatible versions.

Nanosecond precision measurements

Or in other words making measurements 1000 times more precise 💥

This new version gives you much more precision which matters especially if you benchmark very fast functions. It even enables you to see when the compiler might completely optimize an operation away. Let’s take a look at this in action:

range = 1..10
integer1 = :rand.uniform(100)
integer2 = :rand.uniform(100)
Benchee.run(
%{
"Integer addition (wrong)" => fn -> 1 + 1 end,
"Integer addition" => fn -> integer1 + integer2 end,
"String concatention (wrong)" => fn -> "1" <> "1" end,
"adding a head to an array (wrong)" => fn -> [1 | [1]] end,
"++ array concat (wrong)" => fn -> [1] ++ [1] end,
"noop" => fn -> 0 end,
"Enum.map(10)" => fn -> Enum.map(range, fn i -> i end) end
},
time: 1,
warmup: 1,
memory_time: 1,
formatters: [{Benchee.Formatters.Console, extended_statistics: true}]
)
view raw fast.exs hosted with ❤ by GitHub
tobi@speedy:~/github/benchee$ mix run samples/fast_functions.exs
Operating System: Linux
CPU Information: Intel(R) Core(TM) i7-4790 CPU @ 3.60GHz
Number of Available Cores: 8
Available memory: 15.61 GB
Elixir 1.8.0
Erlang 21.2.2
Benchmark suite executing with the following configuration:
warmup: 1 s
time: 1 s
memory time: 1 s
parallel: 1
inputs: none specified
Estimated total run time: 21 s
Benchmarking ++ array concat (wrong)…
Benchmarking Enum.map(10)…
Benchmarking Integer addition…
Benchmarking Integer addition (wrong)…
Benchmarking String concatention (wrong)…
Benchmarking adding a head to an array (wrong)…
Benchmarking noop…
Name ips average deviation median 99th %
String concatention (wrong) 814.22 M 1.23 ns ±2868.77% 0 ns 21 ns
++ array concat (wrong) 749.67 M 1.33 ns ±2705.83% 0 ns 23 ns
noop 639.06 M 1.56 ns ±2388.12% 0 ns 35 ns
adding a head to an array (wrong) 553.47 M 1.81 ns ±2228.78% 0 ns 29 ns
Integer addition (wrong) 544.93 M 1.84 ns ±2803.80% 0 ns 31 ns
Integer addition 179.88 M 5.56 ns ±737.19% 4 ns 39 ns
Enum.map(10) 2.30 M 435.06 ns ±2872.78% 356 ns 667 ns
Comparison:
String concatention (wrong) 814.22 M
++ array concat (wrong) 749.67 M – 1.09x slower
noop 639.06 M – 1.27x slower
adding a head to an array (wrong) 553.47 M – 1.47x slower
Integer addition (wrong) 544.93 M – 1.49x slower
Integer addition 179.88 M – 4.53x slower
Enum.map(10) 2.30 M – 354.23x slower
Extended statistics:
Name minimum maximum sample size mode
String concatention (wrong) 0 ns 9219 ns 1.54 M 0 ns
++ array concat (wrong) 0 ns 17501 ns 1.54 M 0 ns
noop 0 ns 9220 ns 1.53 M 0 ns
adding a head to an array (wrong) 0 ns 23216 ns 1.54 M 0 ns
Integer addition (wrong) 0 ns 16040 ns 1.52 M 0 ns
Integer addition 0 ns 9818 ns 1.52 M 4 ns
Enum.map(10) 335 ns 7385903 ns 952.30 K 354 ns
Memory usage statistics:
Name Memory usage
String concatention (wrong) 0 B
++ array concat (wrong) 0 B
noop 0 B
adding a head to an array (wrong) 0 B
Integer addition (wrong) 0 B
Integer addition 0 B
Enum.map(10) 424 B
**All measurements for memory usage were the same**
view raw output hosted with ❤ by GitHub

You can see that the averages aren’t 0 ns because sometimes the measured run time is very high – garbage collection and such. That’s also why the standard deviation is huge (big difference from 0 to 23000 or so). However, if you look at the median (basically if you sort all measured values, it’s the value is in the middle) and the mode (the most common value) you see that both of them are 0. Even the accompanying memory measurements are 0. Seems like there isn’t much happening there.

So why is that? The compiler optimizes these “benchmarks” away, because they evaluate to one static value that can be determined at compile time. If you write 1 + 1 – the compiler knows you probably mean 2. Smart compilers. To avoid these, we have to trick the compiler by randomizing the values, so that they’re not clear at compile time (see the “right” integer addition).

That’s the one thing we see thanks to our more accurate measurements, the other is that we can now measure how long a map over a range with 10 elements takes (which is around 355 ns for me (I trust the mode and median more her than the average).

How did we accomplish this? Well it all started looking into why measurements on Windows seemed to be weird. We noticed that the implementation of :timer.tc/1 had hard coded the values to be measured in micro seconds:

tc(F) ->
T1 = erlang:monotonic_time(),
Val = F(),
T2 = erlang:monotonic_time(),
Time = erlang:convert_time_unit(T2 – T1, native, microsecond),
{Time, Val}.
view raw timer.erl hosted with ❤ by GitHub

But, in fact nanoseconds are supported! So we now have our own simple time measuring code. This is operating system dependent though, as the BEAM knows about native time units. To the best of our knowledge nanosecond precision is available on Linux and MacOS – not on Windows.

It wasn’t just enough to switch to nano second precision though. See, once you get down to nanoseconds the overhead of simply invoking an anonymous function (which benchee needs to do a lot) becomes noticeable. On my system this overhead is 78 nanoseconds. To compensate, benchee now measures the function call overhead and deducts it from the measured times. That’s how we can achieve measurements of 0ns above – all the code does is return a constant as the compiler optimized it away as the value can be determined at compile time.

A nice side effect is that the overhead heavy function repetition is practically not used anymore on Linux and macOS as no function is faster than nanoseconds. Hence, no more imprecise measurements due to function repetition to make it measurable at all (on Windows we still repeat the function call for instance 100 times and then divide the measured time by this).

Formatter Configuration

This is best shown with an example, up until now if you wanted to pass options to any of the formatters you had to do it like this:

Benchee.run(
%{
"function" => fn -> something end
},
formatters: [
Benchee.Formatters.HTML,
Benchee.Formatters.Console
],
formatter_options: [
html: [file: "output/my.html", auto_open: false, inline_assets: true]
]
)
view raw benchee.exs hosted with ❤ by GitHub

This always felt awkward to me, but it really hit hard when I watched a benchee video tutorial. There the presenter said “…here we configure the formatter to be used and then down here we configure where it should be saved to…” – why would that be in 2 different places? They could be far apart in the code. There is no immediate visible connection between Benchee.Formatters.HTML and the html: down in the formatter_options:.  Makes no sense.

That API was never really well thought out, sadly.
So, what can we do instead? Well of course, bring the options closer together:

Benchee.run(
%{
"function" => fn -> something end
},
formatters: [
{Benchee.Formatters.HTML, file: "output/my.html", auto_open: false, inline_assets: true},
Benchee.Formatters.Console
]
)

So, if you want to pass along options instead of just specifying the module, you specify a tuple of module and options. Easy as pie. You know exactly what formatter the options belong to.

Road to 1.0?

Honestly, 1.0 should have happened many versions ago. Right now the plan is for this to be the last release with user facing features. We’ll mingle the data structure a bit more (see the PR if interested), then put in deprecation warnings for functionality we’ll remove and call it 0.99. Then, remove deprecated functionality and call it 1.0. So, this time indeed – it should be soon ™. I have a track record of sneaking in just one more thing before 1.0 though 😅. You can track our 1.0 progress here.

Why did this take so long?

Looking at this release it’s pretty packed. It should have been 2 releases (one for every major feature described above) that should have happened much sooner.

It’s definitely sad, I double checked: measuring with best available precision landed 21st of May and function call overhead measurement was basically done 27th of June. And the formatter options landed 10th of August. Keeping those out of your hands for so long really saddens me 😖.

Basically, these required updating the formatters, which isn’t particularly fun, but necessary as I want all formatters to be ready to release along a new benchee version. In addition, we put in even more work (specifically Devon in big parts) and added support for memory measurements to all the formatters.

Beyond this? Well, I think life. Life happened. I moved apartments, which is a bunch  of work. Then a lot of things happened at work leading to me eventually quitting my job. Some times there’s just no time or head space for open source. I’m happy though that I’m as confident as one can be in that benchee is robust and bug free software, so that I don’t have to worry about it breaking all the time. I can already see this statement haunting me if this release features numerous weird bugs 😉

In that vain, hope you enjoy the new benchee version – happy to hear feedback, bugs or feature ideas!

And because you made it so far, you deserve an adorable bunny picture:

IMG_20190127_150119.jpg

benchee is now called bunny!

edit: This was an April’s fools joke. However, bunny will remain functional. It’s only implemented as a thing wrapper around benchee so unless we completely break API (which I don’t see coming) it’ll remain functional. Continue reading for cute bunny pictures.

It is time for benchee to take the next step in its evolution as one of the prime benchmarking libraries. Going forward benchee will be called bunny!

IMG_20171207_084810_Bokeh-ANIMATION.gif
Al likes the naming change!

We waited for this very special day to announce this very special naming change – what better day to announce something is being named bunny than Easter Sunday?

It is available on hex.pm now!

But why?

We think this is an abstraction that’s really going to offer us all the flexibility that we’re going to need for future development. As we approach 1.0, we wanted to get the API just right.

This is true courage.

We also haven’t been exactly subtle dropping hints that this naming change was coming. For once I have described benchmarking as bunnies eating food on numerous occasions (each bunny is a function that tries to eat it’s input as fast as it can!). Other than that, the frequently occurring bunny pictures (or even gifs) in benchee Pull Requests could have been a hint.

Also, eating is what they do best:

IMG_20180120_094003_Bokeh-ANIMATION
Yum yum we like benchmarking

For now bunny still works a lot like benchee. However, it exposes a better and more expressive API for your pleasure. You know, bunny can’t only run like the good old benchee. No! Bunny can also sleep, hop, eat and jump!

This all comes with your own personal bunny assistant that helps you benchmark:


list = Enum.to_list(1..10_000)
map_fun = fn(i) -> [i, i * i] end
Bunny.eat(%{
"flat_map" => fn -> Enum.flat_map(list, map_fun) end,
"map.flatten" => fn -> list |> Enum.map(map_fun) |> List.flatten end
})

view raw

eat.exs

hosted with ❤ by GitHub


tobi@speedy ~/github/bunny $ mix run samples/eat.exs
Bunny will take care of that for you!
( Y)
( . .)
o(") (")
Operating System: Linux
CPU Information: Intel(R) Core(TM) i7-4790 CPU @ 3.60GHz
Number of Available Cores: 8
Available memory: 15.61 GB
Elixir 1.6.3
Erlang 20.2
Benchmark suite executing with the following configuration:
warmup: 2 s
time: 5 s
parallel: 1
inputs: none specified
Estimated total run time: 14 s
Benchmarking flat_map…
Benchmarking map.flatten…
Name ips average deviation median 99th %
flat_map 2.23 K 448.25 μs ±14.33% 430 μs 790 μs
map.flatten 1.17 K 857.84 μs ±21.57% 796 μs 1426.98 μs
Comparison:
flat_map 2.23 K
map.flatten 1.17 K – 1.91x slower
Bunny is done!
() ()
(* *)
o( 0 )

view raw

output

hosted with ❤ by GitHub

After all this hard work, the bunny needs to sleep a bit though:

IMG_20180216_102445-ANIMATION.gif

This is clearly better than any other (benchmarking) library out there. What are you waiting for? Go and get bunny now. Also, I mean… just LOOK AT THEM!

IMG_20180120_103418.jpg

IMG_20171221_144500.jpg

IMG_20171221_144657_Bokeh(1).jpg

The curious case of the query that gets slower the fewer elements it affects

I wrote a nice blog post for the company I’m working at (Liefery) called “The curious case of the query that gets slower the fewer elements it affects“, which goes through a real world benchmarking with benchee. It involves a couple of things that can go wrong but how combined indexes and PostgreSQL’s EXPLAIN ANALYZE can help you overcome it problems. It’s honestly one of the blog posts I think I ever wrote so head over and read it if that sounds interesting to you 🙂

Released: benchee 0.10, HTML, CSV and JSON plugins

It’s been a little time since the last benchee release, have we been lazy? Au contraire mes ami! We’ve been hard at work, greatly improving the internals, adding a full system for hooks (before_scenarion, before_each, after_each, after_scenario) and some other great improvements thanks to many contributions. The releases are benchee 0.10.0 (CHANGELOG), benchee_csv 0.7.0 (CHANGELOG), benchee_html 0.4.0 (CHANGELOG) and benchee_json 0.4.0 (CHANGELOG).

Sooo… what’s up? Why did it take so long?

benchee

Before we take a look at the exciting new features, here’s a small summary of major things that happened in previous releases that I didn’t manage to blog about due to lack of time:

0.7.0 added mainly convenience features, but benchee_html 0.2.0 split up the HTML reports which made it easier to find what you’re looking for but also alleviated problems with rendering huge data sets (the graphing library was reaching its limits with that many graphs and input values)

0.8.0 added type specs for the major public functions, configuration is now a struct so errors out on unrecognized options

0.9.0 is one of my favorite releases as it now gathers and shows system data like number of cores, operating system, memory and cpu speed. I love this, because normally when I benchmark I and write about it I need to write it up in the blog post. Now with benchee I can just copy & paste the output and I get all the information that I need! This version also facilitates calling benchee from Erlang, so benchee:run is in the cards.

Now ahead, to the truly new stuff:

Scenarios

In benchee each processing step used to have its own main key in the main data structure (suite): run_times, statistics, jobs etc. Philosophically, that was great. However, it got more cumbersome in the formatters especially after the introduction of inputs as access now required an additional level of indirection (namely, the input). As a result, to get all the data for a combination of job and input you want to format you have got to merge the data of multiple different sources. Not exactly ideal. To make matters worse, we want to add memory measurements in the future… even more to merge.

Long story short, Devon and I sat down in person for 2 hours to discuss how to best deal with this, how to name it and all accompanying fields. We decided to keep all the data together from now on – for every entry of the result. That means each combination of a job you defined and an input. The data structure now keeps that along with its raw run times, statistics etc. After some research we settled on calling it a scenario.


defmodule Benchee.Benchmark.Scenario do
@moduledoc """
A Scenario in Benchee is a particular case of a whole benchmarking suite. That
is the combination of a particular function to benchmark (`job_name` and
`function`) in combination with a specific input (`input_name` and `input`).
It then gathers all data measured for this particular combination during
`Benchee.Benchmark.measure/3` (`run_times` and `memory_usages`),
which are then used later in the process by `Benchee.Statistics` to compute
the relevant statistics (`run_time_statistics` and `memory_usage_statistics`).
"""
@type t :: %__MODULE__{
job_name: binary,
function: fun,
input_name: binary | nil,
input: any | nil,
run_times: [float] | [],
run_time_statistics: Benchee.Statistics.t | nil,
memory_usages: [non_neg_integer] | [],
memory_usage_statistics: Benchee.Statistics.t | nil,
before_each: fun | nil,
after_each: fun | nil,
before_scenario: fun | nil,
after_scenario: fun | nil
}
end

This was a huge refactoring but we really like the improvements it yielded. Devon wrote about the refactoring process in more detail.

It took a long time, but it didn’t add any new features – so no reason for a release yet. Plus, of course all formatters also needed to get updated.

Hooks

Another huge chunk of work went into a hooks system that is pretty fully featured. It allows you to execute code before and after invoking the benchmark as well as setup code before a scenario starts running and teardown code for after a scenario stopped running.

That seems weird, as most of the time you won’t need hooks. We could have released with part of the system ready, but I didn’t want to (potentially) break API again and so soon if we added arguments or found that it wasn’t quite working to our liking. So, we took some time to get everything in.

So what did we want to enable you to do?

  • Load a record from the database in before_each and pass it to the benchmarking function, to perform an operation with it without counting the time for loading the record towards the benchmarking results
  • Start up a process/service in before_scenario that you need for your scenario to run, and then…
  • …shut it down again in after_scenario, or bust a cache
  • Or if you want your benchmarks to run without a cache all the time, you can also bust it in before_each or after_each
  • after_each is also passed the return value of the benchmarking function so you can run assertions on it – for instance for all the jobs to see if they are truly doing the same thing
  • before_each could also be used to randomize the input a bit to benchmark a more diverse set of inputs without the randomizing counting towards the measured times

All of these hooks can be configured either globally so that they run for all the benchmarking jobs or they can be configured on a per job basis. The documentation for hooks over at the repo is a little blog post by itself and I won’t repeat it here 😉

As a little example, here is me benchmarking hound:


# ATTENTION: gotta start phantomjs via `phantomjs –wd` first..
Application.ensure_all_started(:hound)
{:ok, server} = SimpleServer.start
Application.put_env(:hound, :app_host, "http://localhost&quot;)
Application.put_env(:hound, :app_port, SimpleServer.port(server))
use Hound.Helpers
Benchee.run(%{
"fill_in text_field" => fn ->
fill_field({:name, "user[name]"}, "Chris")
end,
"visit forms" => fn ->
navigate_to("#{server.base_url}/forms.html")
end,
"find by css #id" => fn ->
find_element(:id, "button-no-type-id")
end
},
time: 18,
formatters: [
Benchee.Formatters.HTML,
Benchee.Formatters.Console
],
html: [file: "benchmarks/html/hound.html"],
before_scenario: fn(input) ->
Hound.start_session()
navigate_to("#{server.base_url}/forms.html")
input
end,
after_scenario: fn(_return) ->
Hound.end_session
end)

Hound needs to start before we can benchmark it. Howeer, hound seems to remember the started process by the pid of self() at that time. That’s a problem because each benchee scenario runs in its own process, so you couldn’t just start it before invoking Benchee.run. I found no way to make the benchmark work with good old benchee 0.9.0, which is also what finally brought me to implement this feature. Now in benchee 0.10.0 with before_scenario and after_scenario it is perfectly feasible!

Why no 1.0?

With all the major improvements one could easily call this a 1.0. Or 0.6.0 could have been a 1.0 then we’d be at 2.0 now – wow that sounds mature!

Well, I see 1.0 as a promise – a promise for plugin developers and others that compatibility won’t be broken easily and not soon. Can’t promise this when we just broke plugin compatibility in a major way. That said, I really feel good about the new structure, partly because we put so much time and thought into figuring it out, but also because it has greatly simplified some implementations and thinking about some future features it also makes them a lot easier to implement.

Of course, we didn’t break compatibility for users. That has been stable since 0.6.0 and to a (quite big) extent beyond that.

So, 1.0 will of course be coming some time. We might get some more bigger features in that could break compatibility (although I don’t think they will, it will just be new fields):

  • Measuring memory consumption
  • recording and loading benchmarking results
  • … ?

Also before a 1.0 release I probably want to extract more not directly benchmarking related functionality from benchee and provide as general purpose libraries. We have some sub systems that we build for us and would provide value to other applications:

  • Unit: convert units (durations, counts, memory etc.), scale them to a “best fit” unit, format them accordingly, find a best fit unit for a collection of values
  • Statistics: All the statistics we provide including not so easy/standard ones like nth percentile and mode
  • System: gather system data like elixir/erlang version, CPU, Operating System, memory, number of cores

Thanks to the design of benchee these are all already fairly separate so extracting them is more a matter of when, not how. Meaning, that we have all the functionality in those libraries that we need so that we don’t have to make a coordinated release for new features across n libraries.

benchee_html

Selection_045.png

Especially due to many great community contributions (maybe because of Hacktoberfest?) there’s a number of stellar improvements!

  • System information is now also available and you can toggle it with the link in the top right
  • unit scaling from benchee “core” is now also used so it’s not all in micro seconds as before but rather an appropriate unit
  • reports are automatically opened in your browser after the formatter is done (can of course be deactivated)
  • there is a default file name now so you don’t HAVE to supply it

What’s next?

Well this release took long – hope the next one won’t take as long. There’s a couple of improvements that didn’t quite make it into the release so there might be a smaller new release relatively soon. Other than that, work on either serializing or the often requested “measure memory consumption” will probably start some time. But first, we rest a bit 😉

Hope you enjoy benchmarking and if you are missing a feature or getting hit by a bug, please open an issue


Careful what you measure: 2.1 times slower to 4.2 times faster – MJIT versus TruffleRuby

Have you seen the MJIT benchmark results? Amazing, aren’t they? MJIT basically blows the other implementations out of the water! What were they doing all these years? That’s it, we’re done here right?

Well, not so fast as you can infer from the title. But before we can get to what I take issue with in these particular benchmarks (you can of course jump ahead to the nice diagrams) we gotta get some introductions and some important benchmarking basics out of the way.

MJIT? Truffle Ruby? WTF is this?

MJIT currently is a branch of ruby on github by Vladimir Makarov, GCC developer, that implements a JIT (Just In Time Compilation) on the most commonly used Ruby interpreter/CRuby. It’s by no means final, in fact it’s in a very early stage. Very promising benchmarking results were published on the 15th of June 2017, which are in major parts the subject of this blog post.

TruffleRuby is an implementation of Ruby on the GraalVM by Oracle Labs. It poses impressive performance numbers as you can see in my latest great “Ruby plays Go Rumble”. It also implements a JIT, is known to take a bit of a warmup but comes out being ~8 times faster than Ruby 2.0 in the previously mentioned benchmark.

Before we go further…

I have enormous respect for Vladimir and think that MJIT is an incredibly valuable project. Realistically it might be one of our few shots to get a JIT into mainstream ruby. JRuby had a JIT and great performance for years, but never got picked up by the masses (topic for another day).

I’m gonna critique the way the benchmarks were done, but there might be reasons for that, that I’m missing (gonna point out the ones I know). After all, Vladimir has been programming for way longer than I’m even alive and also knows more about language implementations than I do obviously.

Plus, to repeat, this is not about the person or the project, just the way we do benchmarks. Vladimir, in case you are reading this 💚💚💚💚💚💚

What are we measuring?

When you see a benchmark in the wild, first you gotta ask “What was measured?” – the what here comes in to flavors: code and time.

What code are we benchmarking?

It is important to know what code is actually being benchmarked, to see if that code is actually relevant to us or a good representation of a real life Ruby program. This is especially important if we want to use benchmarks as an indication of the performance of a particular ruby implementation.

When you look at the list of benchmarks provided in the README (and scroll up to the list what they mean or look at them) you can see that basically the top half are extremely micro benchmarks:

Selection_041.png

What’s benchmarked here are writes to instance variables, reading constants, empty method calls, while loops and the like. This is extremely micro, maybe interesting from a language implementors point of view but not very indicative of real world ruby performance. The day looking up a constant will be the performance bottle neck in Ruby will be a happy day. Also, how much of your code uses while loops?

A lot of the code (omitting the super micro ones) there isn’t exactly what I’d call typical ruby code. A lot of it is more a mixture of a script and C-code. Lots of them don’t define classes, use a lot of while and for loops instead of the more typical Enumerable methods and sometimes there’s even bitmasks.

Some of those constructs might have originated in optimizations, as they are apparently used in the general language benchmarks. That’s dangerous as well though, mostly they are optimized for one specific platform, in this case CRuby. What’s the fastest Ruby code on one platform can be way slower on the other platforms as it’s an implementation detail (for instance TruffleRuby uses a different String implementation). This puts the other implementations at an inherent disadvantage.

The problem here goes a bit deeper, whatever is in a popular benchmark will inevitably be what implementations optimize for and that should be as close to reality as possible. Hence, I’m excited what benchmarks the Ruby 3×3 project comes up with so that we have some new more relevant benchmarks.

What time are we measuring?

This is truly my favorite part of this blog post and arguably most important. For all that I know the time measurements in the original benchmarks were done like this: /usr/bin/time -v ruby $script which is one of my favorite benchmarking mistakes for programming languages commonly used for web applications. You can watch me go on about it for a bit here.

What’s the problem? Well, let’s analyze the times that make up the total time you measure when you just time the execution of a script: Startup, Warmup and Runtime.

Selection_043.png

  • Startup – the time until we get to do anything “useful” aka the Ruby Interpreter has started up and has parsed all the code. For reference, executing an empty ruby file with standard ruby takes 0.02 seconds for me, MJIT 0.17 seconds and for TruffleRuby it takes 2.5 seconds (there are plans to significantly reduce it though with the help of Substrate VM). This time is inherently present in every measured benchmark if you just time script execution.
  • Warmup – the time it takes until the program can operate at full speed. This is especially important for implementations with a JIT. On a high level what happens is they see which code gets called a lot and they try to optimize this code further. This process takes a lot of time and only after it is completed can we truly speak of “peak performance”. Warmup can be significantly slower than runtime. We’ll analyze the warmup times more further down.
  • Runtime – what I’d call “peak performance” – run times have stabilized. Most/all code has already been optimized by the runtime. This is the performance level that the code will run at for now and the future. Ideally, we want to measure this as 99.99%+ of the time our code will run in a warmed up already started state.

Interestingly, the startup/warmup times are acknowledged in the original benchmark but the way that they are dealt with simply lessens their effect but is far from getting rid of them: “MJIT has a very fast startup which is not true for JRuby and Graal Ruby. To give a better chance to JRuby and Graal Ruby the benchmarks were modified in a way that Ruby MRI v2.0 runs about 20s-70s on each benchmark”.

I argue that in the greater scheme of things, startup and warmup don’t really matter when we are talking about benchmarks when our purpose is to see how they perform in a long lived process.

Why is that, though? Web applications for instance are usually long lived, we start our web server once and then it runs for hours, days, weeks. We only pay the cost of startup and warmup once in the beginning, but run it for a much longer time until we shut the server down again. Normally servers should spend 99.99%+ of their time in the warmed up runtime “state”. This is a fact, that our benchmarks should reflect as we should look for what gives us the best performance for our hours/days/weeks of run time, not for the first seconds or minutes of starting up.

A little analogy here is a car. You wanna go 300 kilometers as fast as possible (straight line). Measuring as shown above is the equivalent of measuring maybe the first ~500 meters. Getting in the car, accelerating to top speed and maybe a bit of time on top speed. Is the car that’s fastest on the first 500 meters truly the best for going 300 kilometers at top speed? Probably not. (Note: I know little about cars)

What does this mean for our benchmark? Ideally we should eliminate startup and warmup time. We can do this by using a benchmarking library written in ruby that also runs the benchmark for a couple of times before actually taking measurements (warmup time). We’ll use my own little library as it means no gem required and it’s well equipped for the rather long run times.

But does startup and warmup truly never matter? It does matter. Most prominently it matters during development time – starting the server, reloading code, running tests. For all of those you gotta “pay” startup and warmup time. Also, if you develop a UI application  or a CLI tool for end users startup and warmup might be a bigger problem, as startup happens way more often. You can’t just warm it up before you take it into the load balancer. Also, running tasks periodically as a cronjob on your server will have to pay theses costs.

So are there benefits to measuring with startup and warmup included? Yes, for one for the use cases mentioned above it is important. Secondly, measuring with time -v gives you a lot more data:


tobi@speedy $ /usr/bin/time -v ~/dev/graalvm-0.25/bin/ruby pent.rb
Command being timed: "/home/tobi/dev/graalvm-0.25/bin/ruby pent.rb"
User time (seconds): 83.07
System time (seconds): 0.99
Percent of CPU this job got: 555%
Elapsed (wall clock) time (h:mm:ss or m:ss): 0:15.12
Average shared text size (kbytes): 0
Average unshared data size (kbytes): 0
Average stack size (kbytes): 0
Average total size (kbytes): 0
Maximum resident set size (kbytes): 1311768
Average resident set size (kbytes): 0
Major (requiring I/O) page faults: 57
Minor (reclaiming a frame) page faults: 72682
Voluntary context switches: 16718
Involuntary context switches: 13697
Swaps: 0
File system inputs: 25520
File system outputs: 312
Socket messages sent: 0
Socket messages received: 0
Signals delivered: 0
Page size (bytes): 4096
Exit status: 0

You get lots of data, among which there’s memory usage, CPU usage, wall clock time and others which are also important for evaluating language implementations which is why they are also included in the original benchmarks.

Setup

Before we (finally!) get to the benchmarks, the obligatory “This is the system I’m running this on”:

The ruby versions in use are MJIT as of this commit from 25th of August compiled with no special settings, graalvm 25 and 27 (more on that in a bit) as well as CRuby 2.0.0-p648 as a baseline.

All of this is run on my Desktop PC running Linux Mint 18.2 (based on Ubuntu 16.04 LTS) with 16 GB of memory and an i7-4790 (3.6 GHz, 4 GHz boost).


tobi@speedy ~ $ uname -a
Linux speedy 4.10.0-33-generic #37~16.04.1-Ubuntu SMP Fri Aug 11 14:07:24 UTC 2017 x86_64 x86_64 x86_64 GNU/Linux

I feel it’s especially important to mention the setup in here, as when I first did these benchmarks for Polyconf on my dual core notebook TruffleRuby had significantly worse results. I think graalvm benefits from the 2 extra cores for warmup etc, as the CPU usage across cores is also quite high.

You can check out the benchmarking script used etc. as part of this repo.

But… you promised benchmarks, where are they?

Sorry, I think the theory is more important than the benchmarks themselves, although they undoubtedly help illustrate the point. We’ll first get into why I chose the pent.rb benchmark as a subject and why I run it with a slightly old versions of graalvm (no worries, current version coming in later on). Then, finally, graphs and numbers.

Why this benchmark?

First of all, the original benchmarks were done with graalvm-0.22. Attempting to reproduce the results with the (at the time current) graalvm-0.25 proved difficult as a lot of them had already been optimized (and 0.22 contained some genuine performance bugs).

One that I could still reproduce the performance problems with was pent.rb and it also seemed like a great candidate to show that something is flawed. In the original benchmarks it is noted down as 0.33 times the performance of Ruby 2.0 (or well, 3 times slower). All my experience with TruffleRuby told me that this is most likely wrong. So, I didn’t choose it because it was the fastest one on TruffleRuby, but rather the opposite – it was the slowest one.

Moreover, while a lot of it isn’t exactly idiomatic ruby code to my mind (no classes, lots of global variables) it uses quite a lot Enumerable methods such as each, collect, sort and uniq while refraining from bitmaskes and the like. So I also felt that it’d make a comparatively good candidate from here.

The way the benchmark is run is basically the original benchmark put into a loop so it is repeated a bunch of times so we can measure the times during warmup and later runtime to get an average of the runtime performance.

So, why am I running it on the old graalvm-0.25 version? Well, whatever is in a benchmark is gonna get optimized making the difference here less apparent.

We’ll run the new improved version later.

MJIT vs. graalvm-0.25

So on my machine the initial execution of the pent.rb benchmark (timing startup, warmup and runtime) on TruffleRuby 0.25 took 15.05 seconds while it just took 7.26 seconds with MJIT. Which has MJIT being 2.1 times faster. Impressive!

What’s when we account for startup and warmup though? If we benchmark just in ruby startup time already goes away, as we can only start measuring inside ruby once the interpreter has started. Now for warmup, we run the code to benchmark in a loop for 60 seconds of warmup time and 60 seconds for measuring the actual runtime. I plotted the execution times of the first 15 iterations below (that’s about when TruffleRuby stabilizes):

2_warmup.png
Execution time of TruffleRuby and MJIT progressing over time – iteration by iteration.

As you can clearly see, TruffleRuby starts out a lot slower but picks up speed quickly while MJIT stay more or less consistent. What’s interesting to see is that iteration 6 and 7 of TrufleRuby are slower again. Either it found a new optimization that took significant time to complete or a deoptimization had to happen as the constraints of a previous optimization were no longer valid. TruffleRuby stabilizes from there and reaches peak performance.

Running the benchmarks we get an average (warm) time for TruffleRuby of 1.75 seconds and for MJIT we get 7.33 seconds. Which means that with this way of measuring, TruffleRuby is suddenly 4.2 times faster than MJIT.

We went from 2.1 times slower to 4.2 times faster and we only changed the measuring method.

I like to present benchmarking numbers in iterations per second/minute (ips/ipm) as here “higher is better” so graphs are far more intuitive, our execution times converted are 34.25 iterations per minute for TruffleRuby and 8.18 iterations per minute for MJIT. So now have a look at our numbers converted to iterations per minute compared for the initial measuring method and our new measuring method:

2_comparison_before_after.png
Results of timing the whole script execution (initial time) versus the average execution time warmed up.

You can see the stark contrast for TruffleRuby caused by the hefty warmup/long execution time during the first couple of iterations. MJIT on the other hand, is very stable. The difference is well within the margin of error.

Ruby 2.0 vs MJIT vs. graalvm-0.25 vs. graalvm-0.27

Well, I promised you more data and here is more data! This data set also includes CRuby 2.0 as the base line as well as the new graalvm.

initial time (seconds) ipm of initial time average (seconds) ipm of average after warmup Standard Deviation as part of total
CRuby 2.0 12.3 4.87 12.34 4.86 0.43%
TruffleRuby 0.25 15.05 3.98 1.75 34.25 0.21%
TruffleRuby 0.27 8.81 6.81 1.22 49.36 0.44%
MJIT 7.26 8.26 7.33 8.18 2.39%

4_warmup.png
Execution times by iteration in second. CRuby stops appearing because that were already all the iterations I had.

We can see that TruffleRuby 0.27 is already faster than MJIT in the first iteration, which is quite impressive. It’s also lacking the weird “getting slower” around the 6th iteration and as such reaches peak performance much faster than TruffleRuby 0.25. It also gets faster overall as we can see if we compare the “warm” performance of all 4 competitors:

4_comparison.png
Iterations per Minute after warmup as an average of our 4 competitors.

So not only did the warmup get much faster in TruffleRuby 0.27 the overall performance also increased quite a bit. It is now more than 6 times faster than MJIT. Of course, some of it is probably the TruffleRuby team tuning it to the existing benchmark, which reiterates my point that we do need better benchmarks.

As a last fancy graph for you I have the comparison of measuring the runtime through time versus giving it warmup time, then benchmarking multiple iterations:

4_comparison_before_after.png
Difference between measuring whole script execution versus letting implementations warmup.

CRuby 2 is quite consistent as expected, TruffleRuby already manages a respectable out of the box performance but gets even faster. I hope this helps you see how the method of measuring can achieve drastically different results.

Conclusion

So, what can we take away? Startup time and warmup are a thing and you should think hard about whether those times are important for you and if you want to measure them. For web applications, most of the time startup and warmup aren’t that important as 99.99%+ you’ll run with a warm “runtime” performance.

Not only what time we measure is important, but also what code we measure. Benchmarks should be as realistic as possible so that they are as significant as possible. What a benchmark on the Internet check most likely isn’t directly related to what your application does.

ALWAYS RUN YOUR OWN BENCHMARKS AND QUESTION BOTH WHAT CODE IS BENCHMARKED, HOW IT IS BENCHMARKED AND WHAT TIMES ARE TAKEN

(I had this in my initial draft, but I ended up quite liking it so I kept it around)

edit1: Added CLI tool specifically to where startup & warmup counts as well as a reference to Substrate VM for how TruffleRuby tries to combat it 🙂

edit2: Just scroll down a little to read an interesting comment by Vladimir

Slides: Stop Guessing and Start Measuring (Poly-Version)

Hello from the amazing Polyconf! I just gave my Stop Guessing and Start Measuring talk and if you are thinking “why do you post the slides of this SO MANY TIMES”, well the first one was an Elixir version, then a Ruby + Elixir version and now we are at a Poly version. The slides are mostly different and I’d say about ~50% of them are new. New topics covered include:

  • MJIT – what’s wrong with the benchmarks – versus TruffleRuby
  • JavaScript!
  • other nice adjustments

The all important video isn’t in the PDF export but you can see a big part of it on Instagram.

You can view the slides here or on speakerdeck, slideshare or PDF.

Abstract

“What’s the fastest way of doing this?” – you might ask yourself during development. Sure, you can guess, your intuition might be correct – but how do you know? Benchmarking is here to give you the answers, but there are many pitfalls in setting up a good benchmark and analyzing the results. This talk will guide you through, introduce best practices, and surprise you with some unexpected benchmarking results. You didn’t think that the order of arguments could influence its performance…or did you?